Tag: DevOps & SRE

Preventing Out-of-Memory (OOM) Kills in Kubernetes: Tips for Optimizing Container Memory Management

Running containerized applications at scale with Kubernetes demands careful resource management. One very complicated but common challenge is preventing Out-of-Memory (OOM) kills, which occur when a container’s memory consumption surpasses its allocated limit. This brutal termination by the Kubernetes kernel’s OOM killer disrupts application stability and can affect application availability and the health of your overall environment.

In this post, we’ll explore the reasons that OOM kills can occur and provide tactics to combat and prevent them.

Before diving in, it’s worth noting that OOM kills represent one symptom that can have a variety of root causes. It’s important for organizations to implement a system that solves the root cause analysis problem with speed and accuracy, allowing reliability engineering teams to respond rapidly, and to potentially prevent these occurrences in the first place.

Deep dive into an OOM kill

An Out-Of-Memory (OOM) kill in Kubernetes occurs when a container exceeds its memory limit, causing the Kubernetes kernel’s OOM killer to terminate the container. This impacts application stability and requires immediate attention.

Several factors can trigger OOM kills in your Kubernetes environment, including:

  • Memory limits exceeded: This is the most common culprit. If a container consistently pushes past its designated memory ceiling, the OOM killer steps in to prevent a system-wide meltdown.
  • Memory leaks: Applications can develop memory leaks over time, where they allocate memory but fail to release it properly. This hidden, unexpected growth eventually leads to OOM kills.
  • Resource overcommitment: Co-locating too many resource-hungry pods onto a single node can deplete available memory. When the combined memory usage exceeds capacity, the OOM killer springs into action.
  • Bursting workloads: Applications with spiky workloads can experience sudden memory surges that breach their limits, triggering OOM kills.

As an example, a web server that experiences a memory leak code bug may gradually consume more and more memory until the OOM killer intervenes to prevent a crash.

Another case could be when a Kubernetes cluster over-commits resources by scheduling too many pods on a single node. The OOM killer may need to step in to free up memory and ensure system stability.

The devastating effects of OOM kills: Why they matter

OOM kills aren’t normally occurring events. They can trigger a cascade of negative consequences for your applications and the overall health of the cluster, such as:

  • Application downtime: When a container is OOM-killed, it abruptly terminates, causing immediate application downtime. Users may experience service disruptions and outages.
  • Data loss: Applications that rely on in-memory data or stateful sessions risk losing critical information during an OOM kill.
  • Performance degradation: Frequent OOM kills force containers to restart repeatedly. This constant churn degrades overall application performance and user experience.
  • Service disruption: Applications often interact with each other. An OOM kill in one container can disrupt inter-service communication, causing cascading failures and broader service outages.

If a container running a critical database service experiences an OOM kill, it could result in data loss and corruption. This leads to service disruptions for other containers that rely on the database for information, causing cascading failures across the entire application ecosystem.

Combating OOM kills

There are a few different tactics to combat OOM kills in attempt to operate a memory-efficient Kubernetes environment.

Set appropriate resource requests and limits 

For example, you can set a memory request of 200Mi and a memory limit of 300Mi for a particular container in your Kubernetes deployment. Requests ensure the container gets at least 200Mi of memory, while limits cap it at 300Mi to prevent excessive consumption.

resources:

  requests:

    memory: "200Mi"

  limits:

    memory: "300Mi"

While this may mitigate potential memory use issues, it is a very manual process and does not deal at all with the dynamic nature of what we can achieve with Kubernetes. It also doesn’t solve the source issue, which may be a code-level problem triggering memory leaks or failed GC processes.

Transition to autoscaling

Leveraging autoscaling capabilities is a core dynamic option for resource allocation. There are two autoscaling methods:

  • Vertical Pod Autoscaling (VPA): VPA dynamically adjusts resource limits based on real-time memory usage patterns. This ensures containers have enough memory to function but avoids over-provisioning.
  • Horizontal Pod Autoscaling (HPA): HPA scales the number of pods running your application up or down based on memory utilization. This distributes memory usage across multiple pods, preventing any single pod from exceeding its limit. The following HPA configuration shows an example of scaling based on memory usage:

apiVersion: autoscaling/v2beta2

kind: HorizontalPodAutoscaler

metadata:

  name: my-app-hpa

spec:

  scaleTargetRef:

    apiVersion: apps/v1

    kind: Deployment

    name: my-app

  minReplicas: 2

  maxReplicas: 10

  metrics:

    - type: Resource

      resource:

        name: memory

        target:

          type: Utilization

          averageUtilization: 80

Monitor memory usage

Proactive monitoring is key. For instance, you can configure Prometheus to scrape memory metrics from your Kubernetes pods every 15 seconds and set up Grafana dashboards to visualize memory usage trends over time. Additionally, you can create alerts in Prometheus to trigger notifications when memory usage exceeds a certain threshold.

Optimize application memory usage

Don’t underestimate the power of code optimization. Address memory leaks within your applications and implement memory-efficient data structures to minimize memory consumption.

Pod disruption budgets (PDB)

When deploying updates, PDBs ensure a minimum number of pods remain available, even during rollouts. This mitigates the risk of widespread OOM kills during deployments. Here is a PDB configuration example that helps ensure minimum pod availability.

apiVersion: policy/v1

kind: PodDisruptionBudget

metadata:

  name: my-app-pdb

spec:

  minAvailable: 80%

  selector:

    matchLabels:

      app: my-app

Manage node resources

You can apply a node selector to ensure that a memory-intensive pod is only scheduled on nodes with a minimum of 8GB of memory. Additionally, you can use taints and tolerations to dedicate specific nodes with high memory capacity for memory-hungry applications, preventing OOM kills due to resource constraints.

nodeSelector:

  disktype: ssd

tolerations:

  - key: "key"

    operator: "Equal"

    value: "value"

    effect: "NoSchedule"

Use QoS classes

Kubernetes offers Quality of Service (QoS) classes that prioritize resource allocation for critical applications. Assign the highest QoS class to applications that can least tolerate OOM kills. Here is a sample resource configuration with QoS parameters:

resources:

  requests:

    memory: "1Gi"

    cpu: "500m"

  limits:

    memory: "1Gi"

    cpu: "500m"

These are a few potential strategies to help prevent OOM kills. The challenge comes with the frequency with which they can occur, and the risk to your applications when they happen.

As you can imagine, it’s not possible to manually manage resource utilization, and guarantee the stability and performance of your containerized applications within your Kubernetes environment.

Manual thresholds = Rigidity and risk

These techniques can help reduce the risk of OOM kills. The issue is not entirely solved though. By setting manual thresholds and limits, you’re removing many of the dynamic advantages of Kubernetes.

A more ideal way to solve the OOM kill problem is to use adaptive, dynamic resource allocation. Even if you get resource allocation right on initial deployment, there are many factors that change that affect how your application consumes resources. There is also a risk because application and resource issues don’t just affect one pod, or one container. Resource issues can reach every part of the cluster and degrade the other running applications and services.

Which strategy works best to prevent OOM kills?

Vertical Pod Autoscaling (VPA) and Horizontal Pod Autoscaling (HPA) are common strategies used to manage resource limits in Kubernetes containers. VPA adjusts resource limits based on real-time memory usage patterns, while HPA scales pods based on memory utilization.

Monitoring with tools like Prometheus may help with the troubleshooting of memory usage trends. Optimizing application memory usage is no easy feat because it’s especially challenging to identify whether it is infrastructure or code causing the problem.

Pod Disruption Budgets (PDB) may help ensure a minimum number of pods remain available during deployments, while node resources can be managed using node selectors and taints. Quality of Service (QoS) classes prioritize resource allocation for critical applications.

One thing is certain: OOM kills are a common and costly challenge to manage using traditional monitoring tools and methods.

At Causely, we’re focused on applying causal reasoning software to help organizations keep applications healthy and resilient. By automating root cause analysis, issues like OOM kills can be resolved in seconds, and unintended consequences of new releases or application changes can be avoided.


Related resources

  • Read the blog: Understanding the Kubernetes Readiness Probe: A Tool for Application Health
  • Read the blog: Bridging the gap between observability and automation with causal reasoning
  • Watch the webinar: What is Causal AI and why do DevOps teams need it?

Understanding the Kubernetes Readiness Probe: A Tool for Application Health

Application reliability is a dynamic challenge, especially in cloud-native environments. Ensuring that your applications are running smoothly is make-or-break when it comes to user experience. One essential tool for this is the Kubernetes readiness probe. This blog will explore the concept of a readiness probe, explaining how it works and why it’s a key component for managing your Kubernetes clusters.

What is a Kubernetes Readiness Probe?

A readiness probe is essentially a check that Kubernetes performs on a container to ensure that it is ready to serve traffic. This check is needed to prevent traffic from being directed to containers that aren’t fully operational or are still in the process of starting up.

By using readiness probes, Kubernetes can manage the flow of traffic to only those containers that are fully prepared to handle requests, thereby improving the overall stability and performance of the application.

Readiness probes also help in preventing unnecessary disruptions and downtime by only including healthy containers in the load balancing process. This is an essential part of a comprehensive SRE operational practice for maintaining the health and efficiency of your Kubernetes clusters.

How Readiness Probes Work

Readiness probes are configured in the pod specification and can be of three types:

  1. HTTP Probes: These probes send an HTTP request to a specified endpoint. If the response is successful, the container is considered ready.
  2. TCP Probes: These probes attempt to open a TCP connection to a specified port. If the connection is successful, the container is considered ready.
  3. Command Probes: These probes execute a command inside the container. If the command returns a zero exit status, the container is considered ready.

Below is an example demonstrating how to configure a readiness probe in a Kubernetes deployment:

apiVersion: v1

kind: Pod

metadata:

  name: readiness-example

spec:

  containers:

  - name: readiness-container

    image: your-image

    readinessProbe:

      httpGet:

        path: /healthz

        port: 8080

      initialDelaySeconds: 5

      periodSeconds: 10

This YAML file defines the Kubernetes pod with a readiness probe configured based on the following parameters:

  1. apiVersion: v1 – Specifies the API version used for the configuration.
  2. kind: Pod – Indicates that this configuration is for a Pod.
  3. metadata:
    • name: readiness-example – Sets the name of the Pod to “readiness-example.”
  4. spec – Describes the desired state of the Pod.
    • containers:
      • name: readiness-container – Names the container within the Pod as “readiness-container.”
      • image: your-image – Specifies the container image to use, named “your-image.”
      • readinessProbe – Configures a readiness probe to check if the container is ready to receive traffic.
        • httpGet:
          • path: /healthz – Sends an HTTP GET request to the /healthz path.
          • port: 8080 – Targets port 8080 for the HTTP GET request.
        • initialDelaySeconds: 5 – Waits 5 seconds before performing the first probe after the container starts.
        • periodSeconds: 10 – Repeats the probe every 10 seconds.

This relatively simple configuration creates a Pod named “readiness-example” with a single container running “your-image.” It includes a readiness probe that checks the /healthz endpoint on port 8080, starting 5 seconds after the container launches and repeating every 10 seconds to determine if the container is ready to accept traffic.

Importance of Readiness Probes

The goal is to make sure you can prevent traffic from being directed to a container that is still starting up or experiencing issues. This helps maintain the overall stability and reliability of your application by only sending traffic to containers that are ready to handle it.

Readiness probes can be used in conjunction with liveness probes to further enhance the health checking capabilities of your containers.

Readiness probes are important for a few reasons:

  • Prevent traffic to unready pods: They ensure that only ready pods receive traffic, preventing downtime and errors.
  • Facilitate smooth rolling updates: By making sure new pods are ready before sending traffic to them.
  • Enhanced application stability: They can help with the overall stability and reliability of your application by managing traffic flow based on pod readiness.

Remember that your readiness probes only check for availability, and don’t understand why a container is not available. Readiness probe failure is a symptom that can manifest from many root causes. It’s important to know the purpose, and limitations before you rely too heavily on them for overall application health.

Related: Causely solves the root cause analysis problem, applying Causal AI to DevOps. Learn about our Causal Reasoning Platform.

Best Practices for Configuring Readiness Probes

To make the most of Kubernetes readiness probes, consider the following practices:

  1. Define Clear Health Endpoints: Ensure your application exposes a clear and reliable health endpoint.
  2. Set Appropriate Timing: Configure initialDelaySeconds and periodSeconds based on your application’s startup and response time.
  3. Monitor and Adjust: Continuously monitor the performance and adjust the probe configurations as needed.

For example, if your application requires a database connection to be fully established before it can serve requests, you can set up a readiness probe that checks for the availability of the database connection.

By configuring the initialDelaySeconds and periodSeconds appropriately, you can ensure that your application is only considered ready once the database connection is fully established. This will help prevent any potential issues or errors that may occur if the application is not fully prepared to handle incoming requests.

Limitations of Readiness Probes

Readiness probes are handy, but they only check for the availability of a specific resource and do not take into account the overall health of the application. This means that even if the database connection is established, there could still be other issues within the application that may prevent it from properly serving requests.

Additionally, readiness probes do not automatically restart the application if it fails the check, so it is important to monitor the results and take appropriate action if necessary. Readiness probes are still a valuable tool for ensuring the stability and reliability of your application in a Kubernetes environment, even with these limitations.

Troubleshooting Kubernetes Readiness Probes: Common Issues and Solutions

Slow Container Start-up

Problem: If your container’s initialization tasks exceed the initialDelaySeconds of the readiness probe, the probe may fail.

Solution: Increase the initialDelaySeconds to give the container enough time to start and complete its initialization. Additionally, optimize the startup process of your container to reduce the time required to become ready.

Unready Services or Endpoints

Problem: If your container relies on external services or dependencies (e.g., a database) that aren’t ready when the readiness probe runs, it can fail. Race conditions may also occur if your application’s initialization depends on external factors.

Solution: Ensure that external services or dependencies are ready before the container starts. Use tools like Helm Hooks or init containers to coordinate the readiness of these components with your application. Implement synchronization mechanisms in your application to handle race conditions, such as using locks, retry mechanisms, or coordination with external components.

Misconfiguration of the Readiness Probe

Problem: Misconfigured readiness probes, such as incorrect paths or ports, can cause probe failures.

Solution: Double-check the readiness probe configuration in your Pod’s YAML file. Ensure the path, port, and other parameters are correctly specified.

Application Errors or Bugs

Problem: Application bugs or issues, such as unhandled exceptions, misconfigurations, or problems with external dependencies, can prevent it from becoming ready, leading to probe failures.

Solution: Debug and resolve application issues. Review application logs and error messages to identify the problems preventing the application from becoming ready. Fix any bugs or misconfigurations in your application code or deployment.

Insufficient Resources

Problem: If your container is running with resource constraints (CPU or memory limits), it might not have the resources it needs to become ready, especially under heavy loads.

Solution: Adjust the resource limits to provide the container with the necessary resources. You may also need to optimize your application to use resources more efficiently.

Conflicts Between Probes

Problem: Misconfigured liveness and readiness probes might interfere with each other, causing unexpected behavior.

Solution: Ensure that your probes are configured correctly and serve their intended purposes. Make sure that the settings of both probes do not conflict with each other.

Cluster-Level Problems

Problem: Kubernetes cluster issues, such as kubelet or networking problems, can result in probe failures.

Solution: Monitor your cluster for any issues or anomalies and address them according to Kubernetes best practices. Ensure that the kubelet and other components are running smoothly.

These are common issues to keep an eye out for. Watch for problems that the readiness probes are not surfacing or that might be preventing them from acting as expected.

Summary

Ensuring that your applications are healthy and ready to serve traffic is necessary for maximizing uptime. The Kubernetes readiness probe is one helpful tool for managing Kubernetes clusters; it should be a part of a comprehensive Kubernetes operations plan.

Readiness probes can be configured in pod specifications and can be HTTP, TCP, or command probes. They help prevent disruptions and downtime by ensuring only healthy containers are included in the load-balancing process.

They also use the prevention of sending traffic to unready pods for smooth rolling updates and enhancing application stability. It’s good practice that your readiness probes include defining clear health endpoints, setting appropriate timing, and monitoring and adjusting configurations.

Don’t forget that readiness probes have clear limitations, as they only check for the availability of a specific resource and do not automatically restart the application if it fails the check. A Kubernetes readiness probe failure is merely a symptom that can be attributed to many root causes. To automate root cause analysis across your entire Kubernetes environment, check out Causely for Cloud-Native Applications.


Related resources

  • Webinar: What is Causal AI and why do DevOps teams need it?
  • Blog: Bridging the gap between observability and automation with causal reasoning
  • Product Overview: Causely for Cloud-Native Applications

Using OpenTelemetry and the OTel Collector for Logs, Metrics, and Traces

OTel Collector is a vendor-agnostic way to receive, process and export telemetry data.

OpenTelemetry (fondly known as OTel) is an open-source project that provides a unified set of APIs, libraries, agents, and instrumentation to capture and export logs, metrics, and traces from applications. The project’s goal is to standardize observability across various services and applications, enabling better monitoring and troubleshooting.

Our team at Causely has adopted OpenTelemetry within our own platform, which prompted us to share a production-focused guide. Our goal is to help developers, DevOps engineers, software engineers, and SREs understand what OpenTelemetry is, its core components, and a detailed look at the OpenTelemetry Collector (OTel Collector). This background will help you use OTel and the OTel Collector as part of a comprehensive strategy to monitor and observe applications.

What Data Does OpenTelemetry Collect?

There are 3 types of data that are gathered by OpenTelemetry using the OTel Collector: logs, metrics, and traces.

Logs

Logs are records of events that occur within an application. They provide a detailed account of what happened, when it happened, and any relevant data associated with the event. Logs are helpful for debugging and understanding the behavior of applications.

OpenTelemetry collects and exports logs, providing insights into events and errors that occur within the system. For example, if a user reports a slow response time in a specific feature of the application, engineers can use OpenTelemetry logs to trace back the events leading up to the reported issue.

Metrics

Metrics are the quantitative data that measure the performance and health of an application. Metrics help in tracking system behavior and identifying trends over time. OpenTelemetry collects metrics data, which helps in tracking resource usage, system performance, and identifying anomalies.

For instance, if a spike in CPU usage is detected using OpenTelemetry metrics, engineers can investigate the potential issue using the OTel data collected and make necessary adjustments to optimize performance.

Developers use OpenTelemetry metrics to see granular resource utilization data, which helps understand how the application is functioning under different conditions.

Traces

Traces provide a detailed view of request flows within a distributed system. Traces help understand the execution path, diagnose application behaviors, and see the interactions between different services.

For example, if a user reports slow response times on a website, developers can use trace data to help better identify which service is experiencing issues. Traces can also help in debugging issues such as failed requests or errors by providing a step-by-step view of how requests are processed through the system.

Introduction to OTel Collector

You can deploy the OTel Collector as a standalone agent or as a sidecar alongside your application. The OTel Collector also includes some helpful features for sampling, filtering, and transforming data before sending it to a monitoring backend.

How it Works

The OTel Collector works by receiving telemetry data from many different sources, processing it based on configured pipelines, and exporting it to chosen backends. This modular architecture allows for customization and scalability.

The OTel Collector acts as a central data pipeline for collecting, processing, and exporting telemetry data (metrics, logs, traces) within an observability stack

Image source: opentelemetry.io


Here’s a technical breakdown:

Data Ingestion:

  • Leverages pluggable receivers for specific data sources (e.g., Redis receiver, MySQL receiver).
  • Receivers can be configured for specific endpoints, authentication, and data collection parameters.
  • Supports various data formats (e.g., native application instrumentation libraries, vendor-specific formats) through receiver implementations.

Data Processing:

  • Processors can be chained to manipulate the collected data before export.
  • Common processing functions include:
    • Batching: Improves efficiency by sending data in aggregates.
    • Filtering: Selects specific data based on criteria.
    • Sampling: Reduces data volume by statistically sampling telemetry.
    • Enrichment: Adds contextual information to the data.

Data Export:

  • Utilizes exporters to send the processed data to backend systems.
  • Exporters are available for various observability backends (e.g., Jaeger, Zipkin, Prometheus).
  • Exporter configurations specify the destination endpoint and data format for the backend system.

Internal Representation:

  • Leverages OpenTelemetry’s internal Protobuf data format (pdata) for efficient data handling.
  • Receivers translate source-specific data formats into pdata format for processing.
  • Exporters translate pdata format into the backend system’s expected data format.

Scalability and Configurability:

  • Designed for horizontal scaling by deploying multiple collector instances.
  • Configuration files written in YAML allow for dynamic configuration of receivers, processors, and exporters.
  • Supports running as an agent on individual hosts or as a standalone service.

The OTel Collector is format-agnostic and flexible, built to work with various backend observability systems.

Setting up the OpenTelemetry (OTel) Collector

Starting with OpenTelemetry for your new system is a straightforward process that takes only a few steps:

  1. Download the OTel Collector: Obtain the latest version from the official OpenTelemetry website or your preferred package manager.
  2. Configure the OTel Collector: Edit the configuration file to define data sources and export destinations.
  3. Run the OTel Collector: Start the Collector to begin collecting and processing telemetry data.

Keep in mind that the example we will show here is relatively simple. A large scale production implementation will require fine-tuning to ensure optimal results. Make sure to follow your OS-specific instructions to deploy and run the OTel collector.

Next, we need to configure some exporters for your application stack.

Integration with Popular Tools and Platforms

Let’s use an example system running a multi-tier web application using NGINX, MySQL, and Redis. Each source platform will have some application-specific configuration parameters.

Configuring Receivers

redisreceiver:

  • Replace receiver_name with redisreceiver
  • Set endpoint to the port where your Redis server is listening (default: 6379)
  • You can configure additional options like authentication and collection intervals in the receiver configuration. Refer to the official documentation for details.

mysqlreceiver:

  • Replace receiver_name with mysqlreceiver
  • Set endpoint to the connection string for your MySQL server (e.g., mysql://user:password@localhost:3306/database)
  • Similar to Redis receiver, you can configure authentication and collection intervals. Refer to the documentation for details.

nginxreceiver:

  • Replace receiver_name with nginxreceiver
  • No endpoint configuration needed as it scrapes metrics from the NGINX process.
  • You can configure what metrics to collect and scraping intervals in the receiver configuration. Refer to the documentation for details.

The OpenTelemetry Collector can export data to multiple providers including Prometheus, Jaeger, Zipkin, and, of course, Causely. This flexibility allows users to leverage their existing tools while adopting OpenTelemetry.

Configuring Exporters

Replace exporter_name with the actual exporter type for your external system. Here are some common options:

Set endpoint to the URL of your external system where you want to send the collected telemetry data. You might need to configure additional options specific to the chosen exporter (e.g., authentication for Jaeger).

There is also a growing list of supporting vendors who consume OpenTelemetry data.

Conclusion

OpenTelemetry provides a standardized approach to collecting and exporting logs, metrics, and traces. Implementing OpenTelemetry and the OTel Collector offer a scalable and flexible solution for managing telemetry data, making it a popular and effective tool for modern applications.

You can use OpenTelemetry as part of your monitoring and observability practice in order to gather data that can help drive better understanding of the state of your applications. The most valuable part of OpenTelemetry is the ability to ingest the data for deeper analysis.

How Causely Works with OpenTelemetry

At Causely, we leverage OpenTelemetry as one of many data sources to assure application reliability for our clients. OpenTelemetry data is ingested by our Causal Reasoning Platform, which detects and remediates application failures in complex cloud-native environments. Causely is designed to be an intuitive, automated way to view and maintain the health of your applications and to eliminate the need for manual troubleshooting.


Related Resources

  • Read the blog: Eating Our Own Dog Food: Causely’s Journey with OpenTelemetry and Causal AI
  • Watch the video: Cracking the Code of Complex Tracing Data: How Causely Uses OpenTelemetry
  • Read the blog: Bridging the Gap Between Observability and Automation with Causal Reasoning

What is Causal AI & why do DevOps teams need it?

Causal AI can help IT and DevOps professionals be more productive, freeing hours of time spent troubleshooting so they can instead focus on building new applications. But when applying Causal AI to IT use cases, there are several domain-specific intricacies that practitioners and developers must be mindful of.

The relationships between application and infrastructure components are complex and constantly evolving, which means relationships and related entities are dynamically changing too. It’s important not to conflate correlation with causation, or to assume that all application issues stem from infrastructure limitations.

In this webinar, Endre Sara defines Causal AI, explains what it means for IT, and talks through specific use cases where it can help IT and DevOps practitioners be more efficient.

We’ll dive into practical implementations, best practices, and lessons learned when applying Causal AI to IT. Viewers will leave with tangible ideas about how Causal AI can help them improve productivity and concrete next steps for getting started.


Tight on time? Check out these highlights


Assure application reliability with Causely

In this video, we’ll show how easy it is to continuously assure application reliability using Causely’s causal AI platform.


In a modern production microservices environment, the number of alerts from observability tooling can quickly amount to hundreds or even thousands, and it’s extremely difficult to understand how all these alerts relate to each other and to the actual root cause. At Causely, we believe these overwhelming alerts should be consumed by software, and root cause analysis should be conducted at machine speed.

Our causal AI platform automatically associates active alerts with their root cause, drives remedial actions, and enables review of historical problems as well. This information streamlines post-mortem analysis, frees DevOps time from complex, manual processes, and helps IT teams plan for upcoming changes that will impact their environment.

Causely installs in minutes and is SOC 2 compliant. Share your troubleshooting stories below or request a live demo – we’d love to see how Causely can help!

On security platforms

🎧 This Tech Tuesday Podcast features Endre Sara, Founding Engineer at Causely!

Causely is bridging observability with automated orchestration for self-managed, resilient applications at scale.

In this episode, Amir and Endre discuss leadership, how to make people’s lives easier by operating complex, large software systems, and why Endre thinks IaC should be boring!

The Fast Track to Fixes: How to Turbo Charge Application Instrumentation & Root Cause Analysis

In the fast-paced world of cloud-native development, ensuring application health and performance is critical. The application of Causal AI, with its ability to understand cause and effect relationships in complex distributed systems, offers the potential to streamline this process.

A key enabler for this is application instrumentation that facilitates an understanding of application services and how they interact with one another through distributed tracing. This is particularly important with complex microservices architectures running in containerized environments like Kubernetes, where manually instrumenting applications for observability can be a tedious and error-prone task.

This is where Odigos comes in.

In this article, we’ll share our experience working with the Odigos community to automate application instrumentation for cloud-native deployments in Kubernetes.

Thanks to Amir Blum for adding resources attributes to native OpenTelemetry instrumentation based on our collaboration. And I appreciate the community accepting my PR to allow easy deployment using a Helm chart in addition to using the CLI in your K8s cluster!

This collaboration enables customers to implement universal application instrumentation and automate root cause analysis process in just a matter of hours.

The Challenges of Instrumenting Applications to Support Distributed Tracing

Widespread application instrumentation remains a hurdle for many organizations. Traditional approaches rely on deploying vendor agents, often with complex licensing structures and significant deployment effort. This adds another layer of complexity to the already challenging task of instrumenting applications.

Because of the complexities and costs involved, many organizations struggle with making the business case for universal deployment, and are therefore very selective about which applications they choose to instrument.

While OpenTelemetry offers a step forward with auto-instrumentation, it doesn’t eliminate the burden entirely. Application teams still need to add library dependencies and deploy the code. In many situations this may meet resistance from product managers who prioritize development of functional requirements over operational benefits.

As applications grow more intricate, maintaining consistent instrumentation across a large codebase is a major challenge, and any gaps leave blind spots in an organization’s observability capabilities.

Odigos to the Rescue: Automating Application Instrumentation

Odigos offers a refreshing alternative. Their solution automates the process of instrumenting all applications running in Kubernetes clusters, with just a few Kubernetes API calls. This eliminates the need to call in applications developers to facilitate the process which may take time and also require approval from product managers. This not only saves development time and effort but also ensures consistent and comprehensive instrumentation across all applications.

Benefits of Using Odigos

Here’s how Odigos is helping Causely and its customers to streamline the process:

  • Reduced development time: Automating instrumentation requires zero effort from development teams.
  • Improved consistency: Odigos ensures consistent instrumentation across all applications, regardless of the developer or team working on them.
  • Enhanced observability: Automatic instrumentation provides a more comprehensive view of application behavior.
  • Simplified maintenance: With Odigos handling instrumentation, maintaining and updating is simple.
  • Deeper insights into microservice communication: Odigos goes beyond HTTP interactions. It automatically instruments asynchronous communication through message queues, including producers and consumer flows.
  • Database and cache visibility: Odigos doesn’t stop at message queues. It also instruments database interactions and caches, giving a holistic view of data flow within applications.
  • Key performance metric capture: Odigos automatically instruments key performance metrics that can be consumed by any OpenTelemetry compliant backend application.

Using Distributed Tracing Data to Automate Root Cause Analysis

Causely consumes distributed tracing data along with observability data from Kubernetes, messaging platforms, databases and caches, whether they are self hosted or running in the cloud, for the following purposes:

  • Mapping application interactions for causal reasoning: Odigos’ tracing data empowers Causely to build a comprehensive dependency graph. This depicts how application services interact, including:
    • Synchronous and asynchronous communication: Both direct calls and message queue interactions between services are captured.
    • Database and cache dependencies: The graph shows how services rely on databases and caches for data access.
    • Underlying infrastructure: The compute and messaging infrastructure that supports the application services is also captured.
Example dependency graph depicting how application services interact

Example dependency graph depicting how application services interact

This dependency graph can be visualized but also is crucial for Causely’s causal reasoning engine. By understanding the interconnectedness of services and infrastructure, Causely can pinpoint the root cause of issues more effectively.

  • Precise state awareness: Causely only consumes the observability data needed to analyze the state of application and infrastructure entities for causal reasoning, ensuring efficient resource utilization.
  • Automated root cause analysis: Through its causal reasoning capability Causely is able to automatically identify the detailed chain of cause and effect relationships between problems and their symptoms in real time, when performance degrades or malfunctions occur in applications and infrastructure. These can be visualized through causal graphs which clearly depict the relationships between root cause problems and the symptoms/impacts that they cause.
  • Time travel: Causely provides the ability to go back in time so devops teams can retrospectively review root cause problems and the symptoms/impacts they caused in the past.
  • Assess application resilience: Causely enables users to reason about what the effect would be if specific performance degradations or malfunctions were to occur in application services or infrastructure.

Want to see Causely in action? Request a demo. 

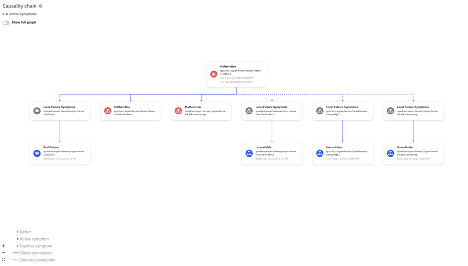
Causal graphs depict the relationships between root cause problems and the symptoms/impacts that they cause

Example causal graph depicting relationships between root cause problems and the symptoms/impacts that they cause

Conclusion

Working with Odigos has been a very smooth and efficient experience. They have enabled our customers to instrument their applications and exploit Causely’s causal reasoning engine within a matter of hours. In doing so they were able to:

  • Instrument their entire application stack efficiently: Eliminating developer overheads and roadblocks without the need for costly proprietary agents.
  • Assure continuous application reliability: Ensuring that KPIs, SLAs, SLOs and SLAs are continually met by proactively identifying and resolving issues.
  • Improve operational efficiency: By minimizing the labor, data, and tooling costs with faster MTTx.

If you would like to learn more about our experience of working together, don’t hesitate to reach out to the teams at Odigos or Causely, or join us in contributing to the Odigos open source observability plane.


Related Resources

Mission Impossible? Cracking the Code of Complex Tracing Data

In this video, we’ll show how Causely leverages OpenTelemetry. (For more on how and why we use OpenTelemetry in our causal AI platform, read the blog from Endre Sara.)


Distributed tracing gives you a bird’s eye view of transactions across your microservices. Far beyond what logs and metrics can offer, it helps you trace the path of a request across service boundaries. Setting up distributed tracing has never been easier. In addition to OpenTelemetry and other existing tracing tools such as Tempo and Jaeger, with open source tools like Grafana Beyla and Keyval Odigos, you can enable distributed tracing in your system without a single line of change.

These tools allow the instrumented applications to start sending traces immediately. But, with potentially hundreds of spans in each trace and millions of traces generated per minute, you can easily become over overwhelmed. Even with a bird’s eye view, you might feel like you’re flying blind.

That’s where Causely comes in. Causely efficiently consumes and analyzes tracing data, automatically constructs a cause and effect relationship, and pinpoints the root cause.

Interested in seeing how Causely makes it faster and easier to use tracing data in your environment so you can understand the root cause of challenging problems?

Comment here or contact us. We hope to hear from you!


Related resources

Eating Our Own Dog Food: Causely’s Journey with OpenTelemetry & Causal AI

Original photo by MART PRODUCTION

Implementing OpenTelemetry at the core of our observability strategy for Causely’s SaaS product was a natural decision. In this article I would like to share some background on our rationale and how the combination of OpenTelemetry and Causal AI addresses several critical requirements that enable us to scale our services more efficiently.
Avoiding Pitfalls Based on Our Prior Experience

We already know from decades of experience working in and with operations teams in the most challenging environments, that bridging the gap between the vast ocean of observability data and actionable insights has and continues to be a major pain point. This is especially true in the complex world of cloud-native applications.

Missing application insights

Application observability remains an elusive beast for many, especially in complex microservices architectures. While infrastructure monitoring has become readily available, neglecting application data paints an incomplete picture, hindering effective troubleshooting and operations.

Siloed solutions

Traditional observability solutions have relied on siloed, proprietary agents and data sources, leading to fragmented visibility across teams and technologies. This makes it difficult to understand the complete picture of service composition and dependencies.

To me this is like trying to solve a puzzle with missing pieces – that’s essentially a problem that many DevOps teams face today – piecing together a picture of how microservices, serverless functions, databases, and other elements interact with one  another, and underlying infrastructure and cloud services they run on. This hinders collaboration and troubleshooting efforts, making it challenging to pinpoint the root cause of performance issues or outages.

Vendor lock-in

Many vendors’ products also lock customers’ data into their cloud services. This can result in customers paying through the nose, because licensing costs are predicated on the volume of data that is being collected and stored in the service providers’ backend SaaS services. It can also be very hard to exit these services once locked in.

These are all pitfalls we want to avoid at Causely as we build out our Causal AI services.

Want to see Causely in action? Request a demo. 

The Pillars of Our Observability Architecture Pointed Us to OpenTelemetry

OpenTelemetry provides us with a path to break free from these limitations, establishing a common framework that transcends programming languages and platforms that we are using to build our services, and satisfying the requirements laid out in the pillars of our observability architecture:

Precise instrumentation

OpenTelemetry offers automatic instrumentation options that minimize the amount of work we need to do on manual code modifications and streamline the integration of our internal observability capabilities into our chosen backend applications.

Unified picture

By providing a standardized data model powered by semantic conventions, OpenTelemetry enables us to paint an end to end picture of how all of our services are composed including application and infrastructure dependencies. We can also gain access to critical telemetry information, leveraging this semantically consistent data across multiple backend microservices even when written in different languages.

Vendor-neutral data management

OpenTelemetry enables us to avoid locking our application data into 3rd party vendors’ services by decoupling it from proprietary vendor formats. This gives us the freedom to choose the best tools on an ongoing basis based on the value they provide, and if something new comes along that we want to exploit, we can easily plug it into our architecture.

Resource-optimized observability

OpenTelemetry enables us to take a top down approach to data collection, starting with the problems we are looking to solve and eliminating unnecessary information. In doing so, this minimizes our storage costs and optimizes compute resources we need to support our observability pipeline.

We believe that following these pillars and building our Causal AI platform on top of OpenTelemetry will propel our product’s performance, enable rock-solid reliability, and ensure consistent service experiences for our customers as we scale our business. We will also minimize our ongoing operational costs, creating a win-win for us and our customers.

OpenTelemetry + Causal AI: Scaling for Performance and Cost Efficiency

Ultimately, observability aims to illuminate the behavior of distributed systems, enabling proactive maintenance and swift troubleshooting. Yet isolated failures manifest as cascading symptoms across interconnected services.

While OpenTelemetry enables back-end applications to use this data to provide a unified picture in maps, graphs and dashboards, the job of figuring out the cause and effect in the correlated data still requires highly skilled resources. This process can also be very time consuming, tying up personnel across multiple teams, with ownership for different elements of overall services.

There is a lot of noise in the industry right now about how AI and LLMs are going to magically come to the rescue, but reality paints a different picture. All of the solutions available in the market today focus on correlating data versus uncovering a direct understanding of causal relationships between problems and the symptoms they cause, leaving devops teams with noise, not answers.

Traditional AI and LLMs also require massive amounts of data as input for training and learning behaviors on a continuous basis. This is data that ultimately ends up being transferred and stored in some form of SaaS. Processing these large datasets is very computationally intensive. This all translates into significant cost overheads for the SaaS providers as customer datasets grow overtime – costs that ultimately result in ever increasing bills for customers.

By contrast, this is where Causal AI comes into its own, taking a fundamentally different approach. Causal AI provides operations and engineering teams with an understanding of the “why”, which is crucial for effective and timely troubleshooting and decision-making.

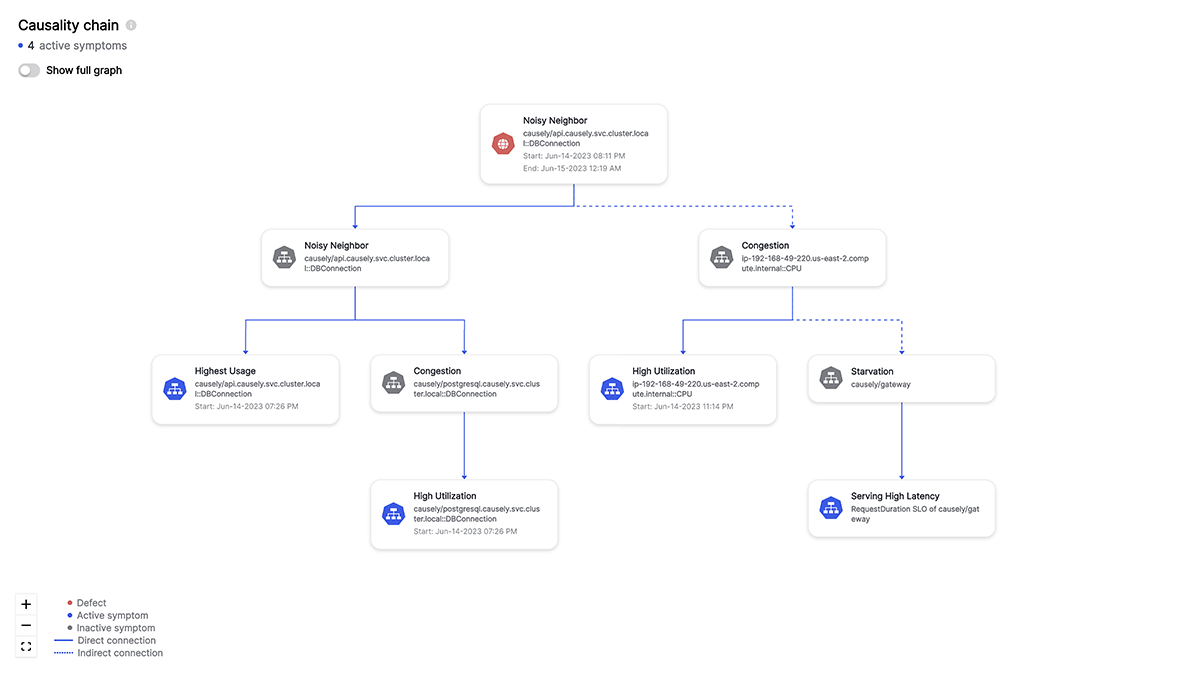
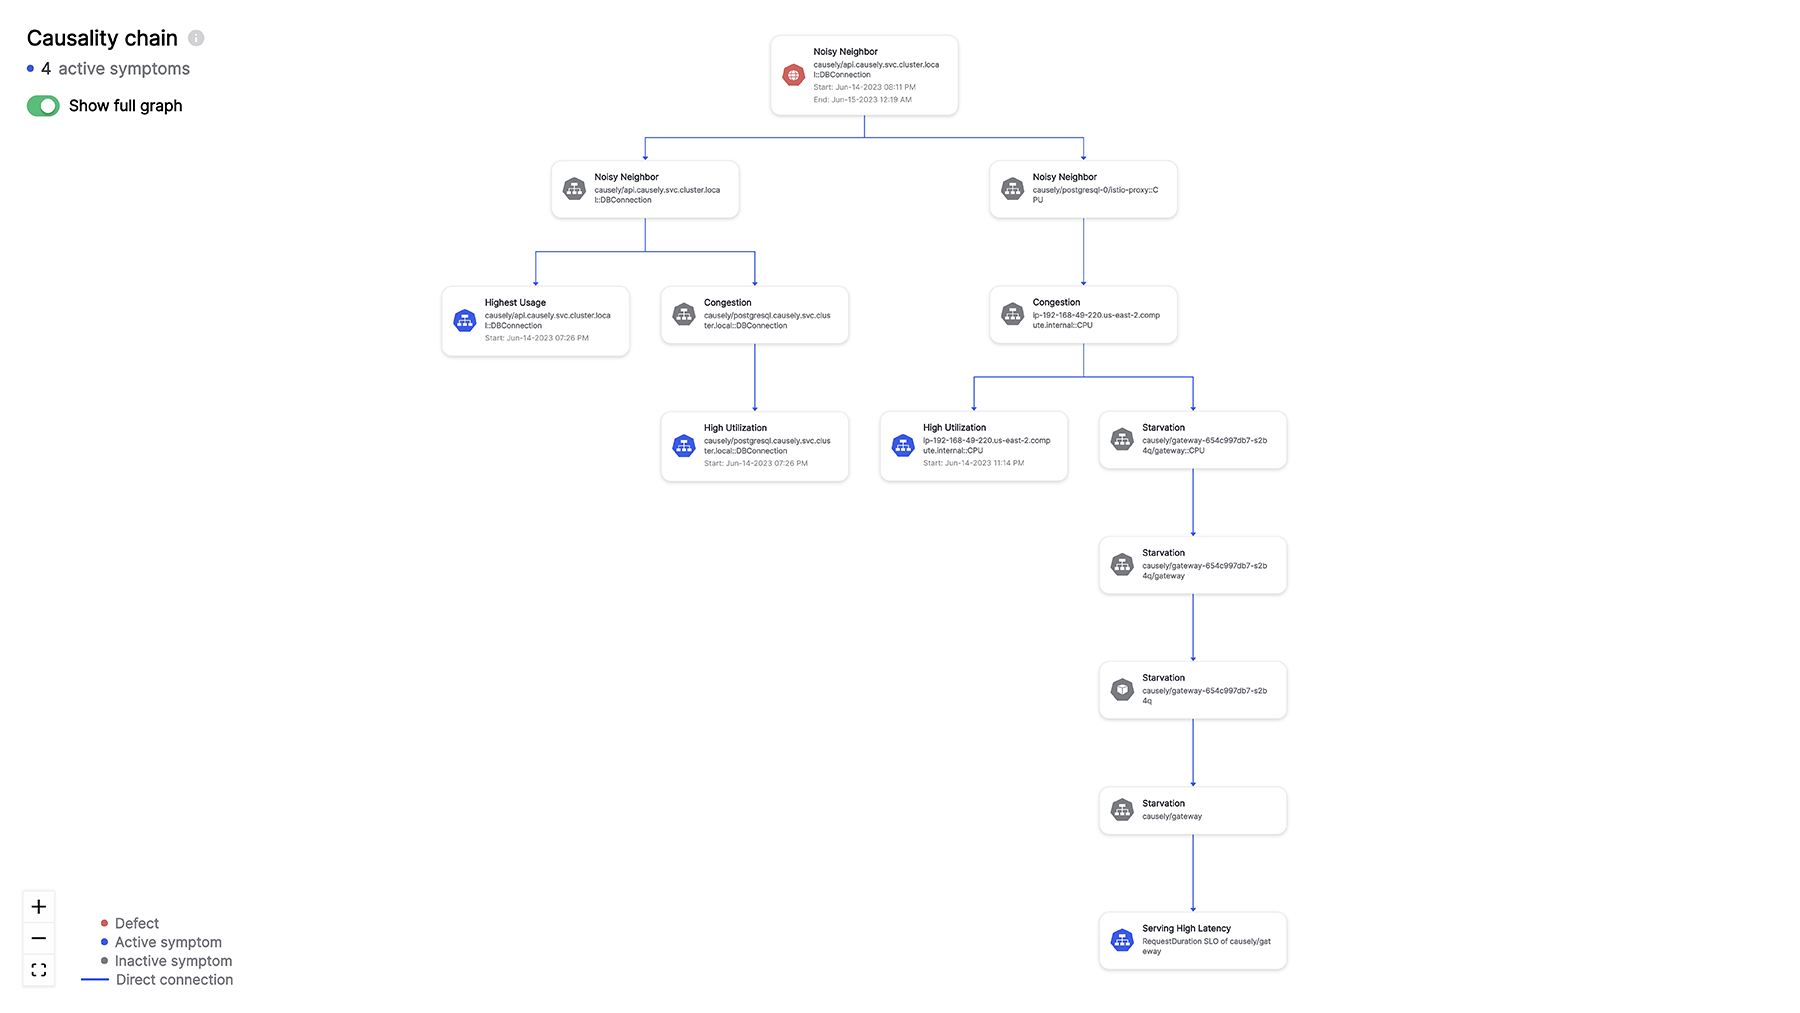
Application: Database Connection Noisy Neighbor causing service and infrastructure symptoms

Example causality chain: Database Connection Noisy Neighbor causing service and infrastructure symptoms

Causal AI uses predefined models of how problems behave and propagate. When combined with real-time information about a system’s specific structure, Causal AI computes a map linking all potential problems to their observable symptoms.

This map acts as a reference guide, eliminating the need to analyze massive datasets every time Causal AI encounters an issue. Think of it as checking a dictionary instead of reading an entire encyclopedia.

The bottom line is, in contrast to traditional AI, Causal AI operates on a much smaller dataset, requires far less resources for computation and provides more meaningful actionable insights, all of which translate into lower ongoing operational costs and profitable growth.

Summing it up

There’s massive potential for Causal AI and OpenTelemetry to come together to tackle the limitations of traditional AI to get to the “why.”  This is what we’re building at Causely. Doing so will result in numerous benefits:

  • Less time on Ops, more time on Dev: OpenTelemetry provides standardized data while Causal AI analyzes it to automate the root cause analysis (RCA) process, which will significantly reduce the time our devops teams have to spend on troubleshooting.
  • Instant gratification, no training lag: We can eliminate AI’s slow learning curve, because Causal AI leverages OpenTelemetry’s semantic language and Causal AI’s domain knowledge of cause and effect to deliver actionable results, right out of the box without massive amounts of data and with no training lag!
  • Small data, lean computation, big impact: Unlike traditional AI’s data gluttony and significant computational overheads, Causal AI thrives on targeted data streams. OpenTelemetry’s smart filtering keeps the information flow lean, allowing Causal AI to identify the root causes with a significantly smaller dataset and compute footprint.
  • Fast root cause identification: Traditional AI might tell us “ice cream sales and shark attacks rise together,” but Causal AI reveals the truth – it’s the summer heat and not the sharks, driving both! By understanding cause-and-effect relationships, Causal AI cuts through the noise and identifies the root causes behind performance degradation and service malfunctions.

Having these capabilities is critical if we want to move beyond the labor intensive processes associated with how RCA is performed in devops today. This is why we are eating our own dog food and using Causely as part of our tech stack to manage the services we provide to customers.

If you would like to learn how to unplug from the Matrix of guesswork and embrace the opportunity offered through the combination of OpenTelemetry and Causal AI, don’t hesitate to reach out! The team and I at Causely are here to share our experience and help you navigate the path.


Related Resources

Causely for asynchronous communication

Causely for async communication - broker OOM

Managing microservices-based applications at scale is challenging, especially when it comes to troubleshooting and pinpointing root causes.

In a microservices-based environment, when a failure occurs, it causes a flood of anomalies across the entire system. Pinpointing the root cause can be as difficult as searching for a needle in a haystack. In this video, we’ll share how Causely can eliminate human heavy lifting and automate the troubleshooting process.


Causely is the operating system to assure application service delivery by automatically preventing failures, pinpointing root causes, and remediating. Causely captures and analyzes cause and effect relationships so you can explore interesting insights and questions about your application environment.

Does this resonate with you? Feel free to share your troubleshooting stories here. We’d love to explore the ways Causely can help you!

Root Cause Chronicles: Connection Collapse

The below post is reposted with permission from its original source on the InfraCloud Technologies blog.

This MySQL connection draining issue highlights the complexity of troubleshooting today’s complex environments, and provides a great illustration of the many rabbit holes SREs find themselves in. It’s critical to understand the ‘WHY’ behind each problem, as it paves the way for faster and more precise resolutions. This is exactly what we at Causely are on a mission to improve using causal AI.
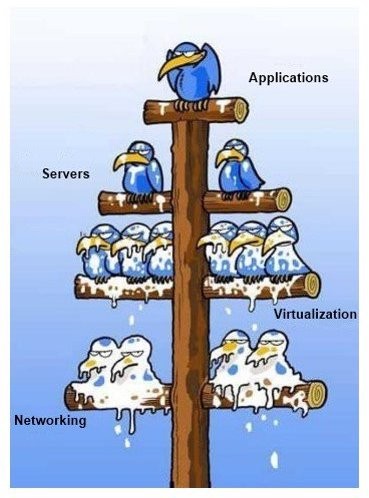

On a usual Friday evening, Robin had just wrapped up their work, wished their colleagues a happy weekend, and turned themselves in for the night. At exactly 3 am, Robin receives a call from the organization’s automated paging system, “High P90 Latency Alert on Shipping Service: 9.28 seconds”.

Robin works as an SRE for Robot-Shop, an e-commerce company that sells various robotics parts and accessories, and this message does not bode well for them tonight. They prepare themselves for a long, arduous night ahead and turn on their work laptop.

Setting the Field

Robot-Shop runs a sufficiently complex cloud native architecture to address the needs of their million-plus customers.

  • The traffic from load-balancer is routed via a gateway service optimized for traffic ingestion, called Web, which distributes the traffic across various other services.
  • User handles user registrations and sessions.
  • Catalogue maintains the inventory in a MongoDB datastore.
  • Customers can see the ratings of available products via the Ratings service APIs.
  • They choose products they like and add them to the Cart, a service backed by Redis cache to temporarily hold the customer’s choices.
  • Once the customer pays via the Payment service, the purchased items are published to a RabbitMQ channel.
  • These are consumed by the Dispatch service and prepared for shipping. Shipping uses MySQL as its datastore, as does Ratings.

(Figure 1: High Level Architecture of Robot-shop Application stack)

Troubles in the Dark

“OK, let’s look at the latency dashboards first.” Robin clicks on the attached Grafana dashboard on the Slack notification for the alert sent by PagerDuty. This opens up the latency graph of the Shipping service.

“How did it go from 1s to ~9.28s within 4-5 minutes? Did traffic spike?” Robin decides to focus on the Gateway ops/sec panel of the dashboard. The number is around ~140 ops/sec. Robin knows this data is coming from their Istio gateway and is reliable. The current number is more than affordable for Robot-Shop’s cluster, though there is a steady uptick in the request-count for Robot-Shop.

None of the other services show any signs of wear and tear, only Shipping. Robin understands this is a localized incident and decides to look at the shipping logs. The logs are sourced from Loki, and the widget is conveniently placed right beneath the latency panel, showing logs from all services in the selected time window. Nothing in the logs, and no errors regarding connection timeouts or failed transactions. So far the only thing going wrong is the latency, but no requests are failing yet; they are only getting delayed by a very long time. Robin makes a note: We need to adjust frontend timeouts for these APIs. We should have already gotten a barrage of request timeout errors as an added signal.

Did a developer deploy an unapproved change yesterday? Usually, the support team is informed of any urgent hotfixes before the weekend. Robin decides to check the ArgoCD Dashboards for any changes to shipping or any other services. Nothing there either, no new feature releases in the last 2 days.

Did the infrastructure team make any changes to the underlying Kubernetes cluster? Any version upgrades? The Infrastructure team uses Atlantis to gate and deploy the cluster updates via Terraform modules. The last date of change is from the previous week.

With no errors seen in the logs and partial service degradation as the only signal available to them, Robin cannot make any more headway into this problem. Something else may be responsible, could it be an upstream or downstream service that the shipping service depends on? Is it one of the datastores? Robin pulls up the Kiali service graph that uses Istio’s mesh to display the service topology to look at the dependencies.

Robin sees that Shipping has now started throwing its first 5xx errors, and both Shipping and Ratings are talking to something labeled as PassthroughCluster. The support team does not maintain any of these platforms and does not have access to the runtimes or the codebase. “I need to get relevant people involved at this point and escalate to folks in my team with higher access levels,” Robin thinks.

Stakeholders Assemble

It’s already been 5 minutes since the first report and customers are now getting affected.

(Figure 5: Detailed Kubernetes native architecture of Robot-shop)

Robin’s team lead Blake joins in on the call, and they also add the backend engineer who owns Shipping service as an SME. The product manager responsible for Shipping has already received the first complaints from the customer support team who has escalated the incident to them; they see the ongoing call on the #live-incidents channel on Slack, and join in. P90 latency alerts are now clogging the production alert channel as the metric has risen to ~4.39 minutes, and 30% of the requests are receiving 5xx responses.

The team now has multiple signals converging on the problem. Blake digs through shipping logs again and sees errors around MySQL connections. At this time, the Ratings service also starts throwing 5xx errors – the problem is now getting compounded.

The Product Manager (PM) says their customer support team is reporting frustration from more and more users who are unable to see the shipping status of the orders they have already paid for and who are supposed to get the deliveries that day. Users who just logged in are unable to see product ratings and are refreshing the pages multiple times to see if the information they want is available.

“If customers can’t make purchase decisions quickly, they’ll go to our competitors,” the PM informs the team.

Blake looks at the PassthroughCluster node on Kiali, and it hits them: It’s the RDS instance. The platform team had forgotten to add RDS as an External Service in their Istio configuration. It was an honest oversight that could cost Robot-Shop significant revenue loss today.

“I think MySQL is unable to handle new connections for some reason,” Blake says. They pull up the MySQL metrics dashboards and look at the number of Database Connections. It has gone up significantly and then flattened. “Why don’t we have an alert threshold here? It seems like we might have maxed out the MySQL connection pool!”

To verify their hypothesis, Blake looks at the Parameter Group for the RDS Instance. It uses the default-mysql-5.7 Parameter group, and max_connections is set to:

{DBInstanceClassMemory/12582880}

But, what does that number really mean? Blake decides not to waste time with checking the RDS Instance Type and computing the number. Instead, they log into the RDS instance with mysql-cli and run:

#mysql> SHOW VARIABLES LIKE "max_connections";

Then Blake runs:

#mysql> SHOW processlist;

“I need to know exactly how many,” Blake thinks, and runs:

#mysql> SELECT COUNT(host) FROM information_schema.processlist;

It’s more than the number of max_connections. Their hypothesis is now validated: Blake sees a lot of connections are in sleep() mode for more than ~1000 seconds, and all of these are being created by the shipping user.

(Figure 13: Affected Subsystems of Robot-shop)

“I think we have it,” Blake says, “Shipping is not properly handling connection timeouts with the DB; it’s not refreshing its unused connection pool.” The backend engineer pulls up the Java JDBC datasource code for shipping and says that it’s using defaults for max-idle, max-wait, and various other Spring datasource configurations. “These need to be fixed,” they say.

“That would need significant time,” the PM responds, “and we need to mitigate this incident ASAP. We cannot have unhappy customers.”

Blake knows that RDS has a stored procedure to kill idle/bad processes.

mysql#> CALL mysql.rds_kill(processID)

Blake tests this out and asks Robin to quickly write a bash script to kill all idle processes.

#!/bin/bash

# MySQL connection details
MYSQL_USER="<user>"
MYSQL_PASSWORD="<passwd>"
MYSQL_HOST="<rds-name>.<id>.<region>.rds.amazonaws.com"

# Get process list IDs
PROCESS_IDS=$(MYSQL_PWD="$MYSQL_PASSWORD" mysql -h "$MYSQL_HOST" -u "$MYSQL_USER" -N -s -e "SELECT ID FROM INFORMATION_SCHEMA.PROCESSLIST WHERE USER='shipping'")

for ID in $PROCESS_IDS; do
MYSQL_PWD="$MYSQL_PASSWORD" mysql -h "$MYSQL_HOST" -u "$MYSQL_USER" -e "CALL mysql.rds_kill($ID)"
echo "Terminated connection with ID $ID for user 'shipping'"
done

The team runs this immediately and the connection pool frees up momentarily. Everyone lets out a visible sigh of relief. “But this won’t hold for long, we need a hotfix on DataSource handling in Shipping,” Blake says. The backend engineer informs they are on it and soon they have a patch-up that adds better defaults for

spring.datasource.max-active
spring.datasource.max-age
spring.datasource.max-idle
spring.datasource.max-lifetime
spring.datasource.max-open-prepared-statements
spring.datasource.max-wait
spring.datasource.maximum-pool-size
spring.datasource.min-evictable-idle-time-millis
spring.datasource.min-idle

The team approves the hotfix and deploys it, finally mitigating a ~30 minute long incident.

Key Takeaways

Incidents such as this can occur in any organization with sufficiently complex architecture involving microservices written in different languages and frameworks, datastores, queues, caches, and cloud native components. A lack of understanding of end-to-end architecture and information silos only adds to the mitigation timelines.

During this RCA, the team finds out that they have to improve on multiple accounts.

  • Frontend code had long timeouts and allowed for large latencies in API responses.
  • The L1 Engineer did not have an end-to-end understanding of the whole architecture.
  • The service mesh dashboard on Kiali did not show External Services correctly, causing confusion.
  • RDS MySQL database metrics dashboards did not send an early alert, as no max_connection (alert) or high_number_of_connections (warning) thresholds were set.
  • The database connection code was written with the assumption that sane defaults for connection pool parameters were good enough, which proved incorrect.

Pressure to resolve incidents quickly that often comes from peers, leadership, and members of affected teams only adds to the chaos of incident management, causing more human errors. Coordinating incidents such as this through the process of having an Incident Commander role has shown more controllable outcomes for organizations around the world. An Incident Commander assumes the responsibility of managing resources, planning, and communications during a live incident, effectively reducing conflict and noise.

When multiple stakeholders are affected by an incident, resolutions need to be handled in order of business priority, working on immediate mitigations first, then getting the customer experience back at nominal levels, and only afterward focusing on long-term preventions. Coordinating these priorities across stakeholders is one of the most important functions of an Incident Commander.

Troubleshooting complex architecture remains a challenging activity to date. However, with the Blameless RCA Framework coupled with periodic metric reviews, a team can focus on incremental but constant improvements of their system observability. The team could also convert all successful resolutions to future playbooks that can be used by L1 SREs and support teams, making sure that similar errors can be handled well.

Concerted effort around a clear feedback loop of Incident -> Resolution -> RCA -> Playbook Creation eventually rids the system of most unknown-unknowns, allowing teams to focus on Product Development, instead of spending time on chaotic incident handling.


That’s a Wrap

Hope you all enjoyed that story about a hypothetical but complex troubleshooting scenario. We see incidents like this and more across various clients we work with at InfraCloud. The above scenario can be reproduced using our open source repository. We are working on adding more such reproducible production outages and subsequent mitigations to this repository.

We would love to hear from you about your own 3 am incidents. If you have any questions, you can connect with me on Twitter and LinkedIn.

References


Related Resources

Understanding failure scenarios when architecting cloud-native applications

Developing and architecting complex, large cloud-native applications is hard. In this short demo, we’ll show how Causely helps to understand failure scenarios before something actually fails in the environment.

In the demo environment we have a dozen applications with database servers, caches running in a cluster, providing multiple services. If we drill into these services and focus on the application, we can only see how the application is behaving right now. But Causely is automatically identifying the potential root causes and alerts that would be caused – services that would be impacted – by failures.

For example, a congested service would cause high latency across a number of different downstream dependencies. A malfunction of this service would make services unavailable and cause high error rates on the dependent services.
Causely is able to reason about the specific dependencies and all the possible root causes – not just for services, but for the applications – in terms of: what would happen if their database query takes too long, if their garbage collection time takes too long, if their transaction latency is high? What services would be impacted, and what alerts would it receive?

This allows developers to design a more resilient system, and operators can understand how to run the environment with their actual dependencies.

We’re hoping that Causely can help application owners avoid production failures and service impact by architecting applications to be resilient in the first place.

What do you think? Share your comments on this use case below.

Troubleshooting cloud-native applications with Causely

Running large, complex, distributed cloud-native applications is hard. This short demo shows how Causely can help.

In this environment, we are running a number of applications with database servers, caches, in a cluster, multiple services, pods, and containers. At any one point in time, we would be getting multiple alerts showing high latency, high CPU utilization, high garbage collection time, high memorization across multiple microservices. Troubleshooting what is the root cause of each one of these alerts is really difficult.

Causely automatically identifies the root cause and shows how the service that is actually congested causing all of these downstream alerts on its dependent services. Instead of individual teams troubleshooting their respective alerts, the team responsible for this product catalog service can focus on remediating and restoring this service while showing all of the other impacted services, so the teams are aware that their problems are caused by congestion in this service. This can significantly reduce the time to detect and to remediate and restore a service.

What do you think? Share your comments on this use case below.

Navigating Kafka and the Challenges of Asynchronous Communication

Example of distributed tracing with sync communication

Welcome back to our series, “One Million Ways to Slow Down Your Application.” Having previously delved into the nuances of Postgres configurations, we now journey into the world of Kafka and asynchronous communication, another critical component of scalable applications.

Kafka 101: An Introduction

Kafka is an open-source stream-processing software platform. Developed by LinkedIn and donated to the Apache Software Foundation, written in Scala and Java. It is designed to handle data streams and provide a unified, high-throughput, low-latency platform for handling real-time data feeds.

Top Use Cases for Kafka

Kafka’s versatility allows for different application use cases, including:

  • Real-Time Analytics: Analyzing data in real-time can provide companies with a competitive edge. Kafka allows businesses to process massive streams of data on the fly.
  • Event Sourcing: This is a method of capturing changes to an application state as a series of events which can be processed, stored, and replayed.
  • Log Aggregation: Kafka can consolidate logs from multiple services and applications, ensuring centralized logging and ease of access.
  • Stream Processing: With tools like Kafka Streams and KSQL, Kafka can be used for complex stream processing tasks.

Typical Failures of Kafka

Kafka is resilient, but like any system, it can fail. Some of the most common failures include:

  • Broker Failures: Kafka brokers can fail due to hardware issues, lack of resources or misconfigurations.
  • Zookeeper Outages: Kafka relies on Zookeeper for distributed coordination. If Zookeeper faces issues, Kafka can be adversely impacted.
  • Network Issues: Kafka relies heavily on networking. Network partitions or latencies can cause data delays or loss.
  • Disk Failures: Kafka persists data on disk. Any disk-related issues can impact its performance or cause data loss.

Typical Manifestations of Kafka Failures

Broker Metrics
Brokers are pivotal in the Kafka ecosystem, acting as the central hub for data transfer. Monitoring these metrics can help you catch early signs of failures:

  • Under Replicated Partitions: A higher than usual count can indicate issues with data replication, possibly due to node failures.
  • Offline Partitions Count: If this is non-zero, it signifies that some partitions are not being served by any broker, which is a severe issue.
  • Active Controller Count: There should only ever be one active controller. A deviation from this norm suggests issues.
  • Log Flush Latency: An increase in this metric can indicate disk issues or high I/O wait, affecting Kafka’s performance.
  • Request Handler Average Idle Percent: A decrease can indicate that the broker is getting overwhelmed.

Consumer Metrics
Consumers pull data from brokers. Ensuring they function correctly is vital for any application depending on Kafka:

  • Consumer Lag: Indicates how much data the consumer is behind in reading from Kafka. A consistently increasing lag may denote a slow or stuck consumer.
  • Commit Rate: A drop in the commit rate can suggest that consumers aren’t processing messages as they should.
  • Fetch Rate: A decline in this metric indicates the consumer isn’t fetching data from the broker at the expected rate, potentially pointing to networking or broker issues.
  • Rebalance Rate: Frequent rebalances can negatively affect the throughput of the consumer. Monitoring this can help identify instability in the consumer group.

Producer Metrics
Producers push data into Kafka. Their health directly affects the timeliness and integrity of data in the Kafka ecosystem:

  • Message Send Rate: A sudden drop can denote issues with the producer’s ability to send messages, possibly due to network issues.
  • Record Error Rate: An uptick in errors can signify that messages are not being accepted by brokers, perhaps due to topic misconfigurations or broker overloads.
  • Request Latency: A surge in latency can indicate network delays or issues with the broker handling requests.
  • Byte Rate: A drop can suggest potential issues in the pipeline leading to the producer or within the producer itself.


The Criticality of Causality in Kafka

Understanding causality between failures and how they are manifested in Kafka is vital. Failures, be they from broker disruptions, Zookeeper outages, or network inconsistencies, send ripples across the Kafka ecosystem, impacting various components. For instance, a spike in consumer lag could be traced back to a broker handling under-replicated partitions, and an increase in producer latency might indicate network issues or an overloaded broker.

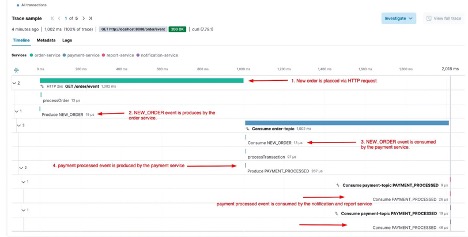
Furthermore, applications using asynchronous communications are much more difficult to troubleshoot than those using synchronous communications. As seen in the examples below, it’s pretty straightforward to troubleshoot using distributed tracing if the communication is synchronous. But with asynchronous communication, there are gaps in the spans that make it harder to understand what’s happening.

Example of distributed tracing with sync communication

Figure 1: Example of distributed tracing with sync communication


Figure 2: Example of distributed tracing for async communication

Figure 2: Example of distributed tracing for async communication


This isn’t about drawing a straight line from failure to manifestation; it’s about unraveling a complex network of events and repercussions. For every failure that occurs, the developer must first manually determine where the failure happened—was it the Broker? The Zookeeper? The Consumer? Following this, they need to zoom in and figure out the specific problem. Is it a broker misconfiguration or a lack of resources? A misconfigured Zookeeper? Or is the consumer application not consuming messages quickly enough, resulting in disk full?

Software automation that captures causality can help get to the correct answer!


A Broker failure causes Producer failure

Figure 3: A Broker failure causes Producer failure

Signing Off

Delving into Kafka highlights the complexities of asynchronous communication in today’s apps. Just like our previous exploration of Postgres, getting the configuration right and understanding causality are key.

By understanding the role of each component and what could go wrong, developer teams can focus on developing applications instead of troubleshooting what happened in Kafka.

Keep an eye out for more insights as we navigate the diverse challenges of managing resilient applications. Remember, it’s not only about avoiding slowdowns, but also about building a system that excels in any situation.


Related Resources

One million ways to slow down your application response time and throughput

Application: Database Connection Noisy Neighbor causing service and infrastructure symptoms

This blog was originally posted on LinkedIn.

Navigating the Perilous Waters of Misconfigured MaxOpenConnection in Postgres Applications

Welcome to the inaugural post in our series, “One Million Ways to Slow Down Your Application Response Time and Throughput”. In this series, we will delve into the myriad of factors that, if neglected, can throw a wrench in the smooth operation of your applications.

Today, we bring to focus a common yet often under-appreciated aspect related to database configuration and performance tuning in PostgreSQL, affectionately known as Postgres. Although Postgres is renowned for its robustness and flexibility, it isn’t exempt from performance downturns if not properly configured. Our focus today shines on the critical yet frequently mismanaged parameter known as MaxOpenConnection.

Misconfiguration of this parameter can lead to skyrocketing response times and plummeting throughput, thereby negatively influencing your application’s performance and overall user experience. This lesson, as you’ll see, was born from our first hand experience.

How much you learnt from mistakes

How much you learnt from mistakes

The Awakening: From Error to Enlightenment

Our journey into understanding the critical role of the MaxOpenConnection parameter in Postgres performance tuning started with a blunder during the development of our Golang application. We employ Gorm to establish a connection to a Postgres database in our application. However, in the initial stages, we overlooked the importance of setting the maximum number of open connections with SetMaxOpenConns, a lapse that rapidly manifested its consequences.

Our API requests, heavily reliant on database interactions, experienced significant slowdowns. Our application was reduced to handling a scanty three Requests Per Second (RPS), resulting in a bottleneck that severely undermined the user experience.

This dismal performance prompted an extensive review of our code and configurations. The cause? Our connection configuration with the Postgres database. We realized that, by not setting a cap on the number of open connections, we were unwittingly allowing an unlimited number of connections, thereby overwhelming our database and causing significant delays in response times.

Quick to rectify our error, we amended our Golang code to incorporate the SetMaxOpenConns function, limiting the maximum open connections to five. Here’s the modified code snippet:

Code snippet with SetMaxOpenConns

Code snippet with SetMaxOpenConns


The difference was monumental. With the same load test, our application’s performance surged, with our RPS amplifying by a remarkable 100 times. This situation underscored the significance of correctly configuring database connection parameters, specifically the MaxOpenConnection parameter.

The MaxOpenConnection Parameter: A Client-Side Perspective

When discussing connection management in a PostgreSQL context, it’s essential to distinguish between client-side and server-side configurations. While Postgres has a server-side parameter known as max_connections, our focus here lies on the client-side control, specifically within our application written in Golang using the GORM library for database operations.

From the client-side perspective, “MaxOpenConnection” is the maximum number of open connections the database driver can maintain for your application. In Golang’s database/SQL package, this is managed using the SetMaxOpenConns function. This function sets a limit on the maximum number of open connections to the database, curtailing the number of concurrent connections the client can establish.

If left un-configured, the client can attempt to open an unlimited number of connections, leading to significant performance bottlenecks, heightened latency, and reduced throughput in your application. Thus, appropriately managing the maximum number of open connections on the client-side is critical for performance optimization.

The Price of Neglecting SetMaxOpenConns

Overlooking the SetMaxOpenConns parameter can severely degrade Postgres database performance. When this parameter isn’t set, Golang’s database/SQL package doesn’t restrict the number of open connections to the database, allowing the client to open a surplus of connections. While each individual connection may seem lightweight, collectively, they can place a significant strain on the database server, leading to:

  • Resource Exhaustion: Each database connection consumes resources such as memory and CPU. When there are too many connections, the database may exhaust these resources, leaving fewer available for executing actual queries. This can undermine your database’s overall performance.
  • Increased Contention: Too many open connections, all vying for the database’s resources (like locks, memory buffers, etc.), result in increased contention. Each connection might have to wait its turn to access the resources it needs, leading to an overall slowdown.
  • Increased I/O Operations: More open connections equate to more concurrent queries, which can lead to increased disk I/O operations. If the I/O subsystem can’t keep pace, this can slow down database operations.

Best Practices for Setting Max Open Connections to Optimize Postgres Performance

Establishing an optimal number for maximum open connections requires careful balance, heavily dependent on your specific application needs and your database server’s capacity. Here are some best practices to consider when setting this crucial parameter:

  • Connection Pooling: Implementing a connection pool can help maintain a cache of database connections, eliminating the overhead of opening and closing connections for each transaction. The connection pool can be configured to have a maximum number of connections, thus preventing resource exhaustion.
  • Tune Max Connections: The maximum number of connections should be carefully calibrated. It’s influenced by your application’s needs, your database’s capacity, and your system’s resources. Setting the number too high or too low can impede performance. The optimal max connections value strikes a balance between the maximum concurrent requests your application needs to serve and the resource limit your database can handle.
  • Monitor and Optimize: Keep a constant eye on your database performance and resource utilization. If you observe a high rate of connection errors or if your database is using too many resources, you may need to optimize your settings.

Signing Off

Our experience highlights the importance of correct configuration when interfacing your application with a Postgres database, specifically parameters like MaxOpenConns. These parameters are not just trivial settings; they play a crucial role in defining the performance of both your application and the database.

Ignoring these parameters is akin to driving a car without brakes. By comprehending the implications of each setting and configuring them accordingly, you can stave off unnecessary performance bottlenecks and deliver a smoother, faster user experience. It’s not merely about making your application work – it’s about ensuring it functions efficiently and effectively.

To conclude, it’s crucial to understand that there is no universally applicable method to set up database connections. It’s not merely about setting thresholds for monitoring purposes, as this often leads to more disturbance than usefulness. The critical aspect to keep an eye on is potential misuse of the database connection by a client, leading to adverse effects on the database and its other clients. This becomes especially complex when dealing with shared databases, as the “noisy neighbor” phenomenon can exacerbate problems if an application isn’t correctly set up. Each application has distinct needs and behaviors, thus requiring a carefully thought-out, bespoke configuration to guarantee maximum efficiency.

Bonus

Curious about the potential symptoms caused by a noisy application on a database connection? Take a look at the causality view presented by Causely:

Application: Database Connection Noisy Neighbor causing service and infrastructure symptoms

Application: Database Connection Noisy Neighbor causing service and infrastructure symptoms

According to the causality diagram, the application noisy neighbor of the database connection leads to increased CPU usage in the Postgres container. Consequently, the Postgres container becomes the noisy neighbor of the CPU on the specific Kind node where it runs on. This elevated CPU utilization on the Kind node directly results in higher service latency for clients attempting to access the service provided by the pods residing on the same node. Therefore, addressing each issue individually by merely allocating more resources equates to applying a temporary fix rather than a sustainable solution.

Learn more

DevOps may have cheated death, but do we all need to work for the king of the underworld?

Causality Chain
Sisyphus

Sisyphus. Source: https://commons.wikimedia.org/wiki/File:Punishment_sisyph.jpg

This blog was originally posted on LinkedIn.

How causality can eliminate human troubleshooting

Tasks that are both laborious and futile are described as Sisyphean. In Greek mythology, Sisyphus was the founder and king of Ephyra (now known as Corinth). Hades – the king of the underworld – punished him for cheating death twice by forcing him to roll an immense boulder up a hill only for it to roll back down every time it neared the top, repeating this action for eternity.

The goal of application support engineers is to identify, detect, remediate, and prevent failures or violations of service level objectives (SLOs). DevOps have been pronounced dead by some, but still seem to be tasked with building and running apps at scale. Observability tools provide comprehensive monitoring, proactive alerting, anomaly detection, and maybe even some automation of routine tasks, such as scaling resources. But they leave the Sisyphean heavy lifting job of troubleshooting, incident response and remediation, as well as root cause analysis and continuous improvements during or after an outage, to humans.

Businesses are changing rapidly; application management has to change

Today’s environments are highly dynamic. Businesses must be able to rapidly adjust their operations, scale resources, deliver sophisticated services, facilitate seamless interactions, and adapt quickly to changing market conditions.

The scale and complexity of application environments is expanding continuously. Application architectures are increasingly complex, with organizations relying on a larger number of cloud services from multiple providers. There are more systems to troubleshoot and optimize, and more data points to keep track of. Data is growing exponentially across all technology domains affecting its collection, transport, storage, and analysis. Application management relies on technologies that try to capture this growing complexity and volume, but those technologies are limited by the fact that they’re based on data and models that assume that the future will look a lot like the past. This approach can be effective in relatively static environments where patterns and relationships remain consistent over time. However, in today’s rapidly changing environments, this will fail.

As a result, application support leaders find it increasingly difficult to manage the increasing complexity and growing volume of data in cloud-native technology stacks. Operating dynamic application environments is simply beyond human scale, especially in real time. The continuous growth of data generated by user interactions, cloud instances, and containers requires a shift in mindset and management approaches.

Relationships between applications and infrastructure components are complex and constantly changing

A major reason that relationships and related entities are constantly changing is because of the complicated and dynamic nature of application and infrastructure components. Creating a new container and destroying it takes seconds to minutes each time, and with every change includes changes to tags, labels, and metrics. This demonstrates the sheer volume, cardinality, and complexity of observability datasets.

The complexity and constant change within application environments is why it can take days to figure out what is causing a problem. It’s hard to capture causality in a dataset that’s constantly changing based on new sets of applications, new databases, new infrastructure, new software versions, etc. As soon as you identify one correlation, the landscape has likely already changed.

Correlation is not causation

Correlation is not causation. Source: https://twitter.com/OdedRechavi/status/1442759942553968640/photo/1

Correlation is NOT causation

The most common trap that people fall into is assuming correlation equals causation. Correlation and causation both indicate a relationship exists between two occurrences, but correlation is non-directional, while causation implies direction. In other words, causation concludes that one occurrence was the consequence of another occurrence.

It’s important to clearly distinguish correlation from causation before jumping to any conclusions. Neither pattern identification nor trend identification is causation. Even if you apply correlation on top of an identified trend, you won’t get the root cause. Without causality, you cannot understand the root cause of a set of observations and without the root cause, the problem cannot be resolved or prevented in the future.

Blame the network

Blame the network. Source @ioshints

Don’t assume that all application issues are caused by infrastructure

In application environments, the conflation between correlation and causation often manifests through assumptions that symptoms propagate on a predefined path – or, to be more specific, that all application issues stem from infrastructure limitations or barriers. How many times have you heard that it is always “the network’s fault”?

In a typical microservices environment, application support teams will start getting calls and alerts about various clients experiencing high latency, which will also lead to the respective SLOs being violated. These symptoms can be caused by increased traffic, inefficient algorithms, misconfigured or insufficient resources or noisy neighbors in a shared environment. Identifying the root cause across multiple layers of the stack, typically managed by different application and infrastructure teams, can be incredibly difficult. It requires not just observability data including logs, metrics, time-series anomalies, and topological relationships, but also the causality knowledge to reason if this is an application problem impacting the infrastructure vs. an infrastructure problem impacting the applications, or even applications and microservices impacting each other.

Capture knowledge, not just data

Gathering more data points about every aspect of an application environment will not enable you to learn causality – especially in a highly dynamic application environment. Causation can’t be learned only by observing data or generating more alerts. It can be validated or enhanced as you get data, but you shouldn’t start there.

Think failures/defects, not alerts

Start by thinking about failures/defects instead of the alerts or symptoms that are being observed. Failures require intervention and either recur or currently cannot be resolved. Only when you know the failures you care about should you look at the alerts or symptoms that may be caused by them.

Root cause analysis (RCA) is the problem of inferring failures from an observed set of symptoms. For example, bad choices of algorithms or data structures may cause service latency, high CPU or high memory utilization as observed symptoms and alerts. The root cause of bad choices of algorithms and data structures can be inferred from the observed symptoms.

Causal AI is required to solve the RCA problem

Causal AI is an artificial intelligence system that can explain cause and effect. Unlike predictive AI models that are based on historical data, systems based on causal AI provide insight by identifying the underlying web of causality for a given behavior or event. The concept of causal AI and the limits of machine learning were raised by Judea Pearl, the Turing Award-winning computer scientist and philosopher, in The Book of Why: The New Science of Cause and Effect.

“Machines’ lack of understanding of causal relations is perhaps the biggest roadblock to giving them human-level intelligence.”
– Judea Pearl, The Book of Why

Causal graphs are the best illustration of causal AI implementations. A causal graph is a visual representation that usually shows arrows to indicate causal relationships between different events across multiple entities.

Causality Chain

Database Noisy Neighbor causing service and infrastructure symptoms

In this example, we are observing multiple clients experiencing errors and service latency, as well as neighboring microservices suffering from not getting enough compute resources. Any attempt to tackle the symptoms independently, by for instance increasing CPU limit, or horizontal scaling the impacted service, will not solve the REAL problem.

The best explanation for this combination of observed symptoms is the problem with the application’s interaction with the database. The root cause can be inferred even when not all the symptoms are observed. Instead of troubleshooting individual client errors or infrastructure symptoms, the application support team can focus on the root cause and fix the application.

Capturing this human knowledge in a declarative form allows causal AI to reason about not just the observed symptoms but also the missing symptoms in the context of the causality propagations between application and infrastructure events. You need to have a structured way of capturing the knowledge that already exists in the minds and experiences of application support teams.

Wrapping up

Hopefully this blog helps you to begin to think about causality and how you can capture your own knowledge in causality chains like the one above. Human troubleshooting needs to be relegated to history and replaced with automated causality systems.

This is something we think about a lot at Causely, and would love any feedback or commentary about your own experiences trying to solve these kinds of problems.

Related resources