Tag: Causely product

Beyond the Blast Radius: Demystifying and Mitigating Cascading Microservice Issues

Microservices architectures offer many benefits, but they also introduce new challenges. One such challenge is the cascading effect of simple failures. A seemingly minor issue in one microservice can quickly snowball, impacting other services and ultimately disrupting user experience.

The Domino Effect: From Certificate Expiry to User Frustration

Imagine a scenario where a microservice’s certificate expires. This seemingly trivial issue prevents it from communicating with others. This disruption creates a ripple effect:

  • Microservice Certificate Expiry: The seemingly minor issue is a certificate going past its expiration date.
  • Communication Breakdown: This expired certificate throws a wrench into the works, preventing the microservice from securely communicating with other dependent services. It’s like the microservice is suddenly speaking a different language that the others can’t understand.
  • Dependent Service Unavailability: Since the communication fails, dependent services can no longer access the data or functionality provided by the failing microservice. Imagine a domino not receiving the push because the first one didn’t fall.
  • Errors and Outages: This lack of access leads to errors within dependent services. They might malfunction or crash entirely, causing outages – the domino effect starts picking up speed.
  • User Frustration (500 Errors): Ultimately, these outages translate to error messages for the end users. They might see cryptic “500 errors” or experience the dreaded “service unavailable” message – the domino effect reaches the end user, who experiences the frustration.

The Challenge: Untangling the Web of Issues

Cascading failures pose a significant challenge due to the following reasons:

  • Network Effect: The root cause gets obscured by the chain reaction of failures, making it difficult to pinpoint the source.
  • Escalation Frenzy: Customer complaints trigger incident tickets, leading to a flurry of investigations across multiple teams (DevOps Teams, Service Desk, customer support, etc.).
  • Resource Drain: Troubleshooting consumes valuable time from developers, SREs, and support personnel, diverting them from core tasks.
  • Hidden Costs: The financial impact of lost productivity and customer dissatisfaction often goes unquantified.

Beyond Certificate Expiry: The Blast Radius of Microservice Issues

Certificate expiry is just one example. Other issues with similar cascading effects include:

  • Noisy Neighbors: A resource-intensive microservice can degrade performance for others sharing the same resources (databases, applications) which in turn impact other services that depend on them.
  • Code Bugs: Code errors within a microservice can lead to unexpected behavior and downstream impacts.
  • Communication Bottlenecks: Congestion or malfunctioning in inter-service communication channels disrupts data flow and service availability.
  • Third-Party Woes: Outages or performance issues in third-party SaaS services integrated with your microservices can create a ripple effect.

Platform Pain Points: When Infrastructure Falters

The impact can extend beyond individual microservices. Platform-level issues can also trigger cascading effects:

  • Load Balancer Misconfigurations: Incorrectly configured load balancers can disrupt service delivery to clients and dependent services.
  • Container Cluster Chaos: Problems within Kubernetes pods, nodes, can lead to application failures and service disruptions.

Blast Radius and Asynchronous Communication: The Data Lag Challenge

Synchronous communication provides immediate feedback, allowing the sender to know if the message was received successfully. In contrast, asynchronous communication introduces a layer of complexity:

  • Unpredictable Delivery: Messages may experience varying delays or, in extreme cases, be lost entirely. This lack of real-time confirmation makes it difficult to track the message flow and pinpoint the exact location of a breakdown.
  • Limited Visibility: Unlike synchronous communication where a response is readily available, troubleshooting asynchronous issues requires additional effort. You may only have user complaints as a starting point, which can be a delayed and incomplete indicator of the problem.

The root cause of problems could be because of several factors that result delays or lost messages in asynchronous communication:

Microservice Issues:

  • Congestion: A microservice overloaded with tasks may struggle to process or send messages promptly, leading to delays.
  • Failures: A malfunctioning microservice may be entirely unable to process or send messages, disrupting the flow of data.

Messaging Layer Issues:

Problems within the messaging layer itself can also cause disruptions:

  • Congestion: Congestion in message brokers, clusters, or cache instances can lead to delays in message delivery.
  • Malfunctions: Malfunctions within the messaging layer can cause messages to be lost entirely.

The Cause & Effect Engine: Unveiling the Root of Microservice Disruptions in Real Time

So what can we do to tame this chaos?

Imagine a system that acts like a detective for your application services. It understands all of the cause-and-effect relationships within your complex architecture. It does this by automatically discovering and analyzing your environment to maintain an up-to-date picture of services, infrastructure and dependencies and from this computes a dynamic knowledge base of root causes and the effects they will have.

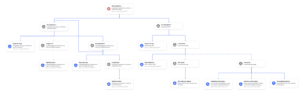
This knowledge is automatically computed in a Causality Graph that depicts all of the relationships between the potential root causes that could occur and the symptoms they may cause. In an environment with thousands of entities, it might represent hundreds of thousands of problems and the set of symptoms each one will cause.

A separate data structure is derived from this called a “Codebook“. This table is like a giant symptom checker, mapping all the potential root causes (problems) to the symptoms (errors) they might trigger.

Hence, each root cause in the Codebook has a unique signature, a vector of m probabilities, that uniquely identifies the root cause. Using the Codebook, the system quickly searches and pinpoints the root causes based on the observed symptoms.

The Causality Graph and Codebook are constantly updated as application services and infrastructure evolve. This ensures the knowledge in the Causality Graph and Codebook stays relevant and adapts to changes.

These powerful capabilities enable:

  • Machine Speed Root Cause Identification: Unlike traditional troubleshooting, the engine can pinpoint the culprit in real time, saving valuable time and resources.
  • Prioritization Based on Business Impact: By revealing the effects of specific root causes on related services, problem resolution can be prioritized.
  • Reduced Costs: Faster resolution minimizes downtime and associated costs.
  • Improved Collaboration: Teams responsible for failing services receive immediate notifications and a visualize a Causality Graph explaining the issue’s origin and impact. This streamlines communication and prioritizes remediation efforts based on the effect the root cause problem has.
  • Automated Actions: In specific cases, the engine can even trigger automated fixes based on the root cause type.
  • Empowered Teams: Teams affected by the problem are notified but relieved of troubleshooting burdens. They can focus on workarounds or mitigating downstream effects, enhancing overall system resilience.

The system represents a significant leap forward in managing cloud native applications. By facilitating real-time root cause analysis and intelligent automation, it empowers teams to proactively address disruptions and ensure the smooth operation of their applications.

The knowledge in the system is not just relevant to optimize the incident response process. It is also valuable for performing “what if” analysis to understand what the impact of future changes and planned maintenance will have so that steps can be taken to proactively understand and mitigate the risks of these activities.

Through its understanding of cause and effect, it can also play a role in business continuity planning, enabling teams to identify single points of failure in complex services to improve service resilience.

The system can also be used to streamline the process of incident postmortems because it contains the prior history of previous root cause problems, why they occurred and what the effect was — their causality. This avoids the complexity and time involved in reconstructing what happened and enables mitigating steps to be taken to avoid recurrences.

The Types of Root Cause Problems & Their Effects

The system computes its causal knowledge based on Causal Models. These describe the behaviours of how root cause problems will propagate symptoms along relationships to dependent entities independently of a given environment. This knowledge is instantiated through service and infrastructure auto discovery to create the Causal Graph and Codebook.

Examples of these types of root cause problems that are modeled in the system include:

Science Fiction or Reality

The inventions behind the system go back to the 90’s, and was at the time and still is groundbreaking. It was successfully deployed, at scale, by some of the largest telcos, system integrators and Fortune 500 companies in the early 2000’s. You can read about the original inventions here.

Today the problems that these inventions set out to address have not changed and the adoption of cloud-native technologies has only heightened the need for a solution. As real-time data has become pervasive in today’s application architectures, every second of service disruption is a lost business opportunity.

These inventions have been taken and engineered in a modern, commercially available platform by Causely to address the challenges of assuring continuous application reliability in the cloud-native world. The founding engineering team at Causely were the creators of the tech behind two high-growth companies: SMARTS and Turbonomic.

If you would like to learn more about this, don’t hesitate to reach out to me directly or comment here.


Related Resources

Causely Overview

Causality diagram in Causely

Causely assures continuous reliability of cloud applications. Causely for Cloud-Native Applications, built on our Causal Reasoning Platform, automatically captures cause and effect relationships based on real-time, dynamic data across the entire application environment. This means that we can detect, remediate and even prevent problems that result in service impact. With Causely, Dev and Ops teams are better equipped to plan for ongoing changes to code, configurations or load patterns, and they stay focused on achieving service-level and business objectives instead of firefighting.

Watch the video to see Causely in action, or schedule time for a live walk-through.

Assure application reliability with Causely

In this video, we’ll show how easy it is to continuously assure application reliability using Causely’s causal AI platform.


In a modern production microservices environment, the number of alerts from observability tooling can quickly amount to hundreds or even thousands, and it’s extremely difficult to understand how all these alerts relate to each other and to the actual root cause. At Causely, we believe these overwhelming alerts should be consumed by software, and root cause analysis should be conducted at machine speed.

Our causal AI platform automatically associates active alerts with their root cause, drives remedial actions, and enables review of historical problems as well. This information streamlines post-mortem analysis, frees DevOps time from complex, manual processes, and helps IT teams plan for upcoming changes that will impact their environment.

Causely installs in minutes and is SOC 2 compliant. Share your troubleshooting stories below or request a live demo – we’d love to see how Causely can help!

Mission Impossible? Cracking the Code of Complex Tracing Data

In this video, we’ll show how Causely leverages OpenTelemetry. (For more on how and why we use OpenTelemetry in our causal AI platform, read the blog from Endre Sara.)


Distributed tracing gives you a bird’s eye view of transactions across your microservices. Far beyond what logs and metrics can offer, it helps you trace the path of a request across service boundaries. Setting up distributed tracing has never been easier. In addition to OpenTelemetry and other existing tracing tools such as Tempo and Jaeger, with open source tools like Grafana Beyla and Keyval Odigos, you can enable distributed tracing in your system without a single line of change.

These tools allow the instrumented applications to start sending traces immediately. But, with potentially hundreds of spans in each trace and millions of traces generated per minute, you can easily become over overwhelmed. Even with a bird’s eye view, you might feel like you’re flying blind.

That’s where Causely comes in. Causely efficiently consumes and analyzes tracing data, automatically constructs a cause and effect relationship, and pinpoints the root cause.

Interested in seeing how Causely makes it faster and easier to use tracing data in your environment so you can understand the root cause of challenging problems?

Comment here or contact us. We hope to hear from you!


Related resources

Eating Our Own Dog Food: Causely’s Journey with OpenTelemetry & Causal AI

Original photo by MART PRODUCTION

Implementing OpenTelemetry at the core of our observability strategy for Causely’s SaaS product was a natural decision. In this article I would like to share some background on our rationale and how the combination of OpenTelemetry and Causal AI addresses several critical requirements that enable us to scale our services more efficiently.

Avoiding Pitfalls Based on Our Prior Experience

We already know from decades of experience working in and with operations teams in the most challenging environments, that bridging the gap between the vast ocean of observability data and actionable insights has and continues to be a major pain point. This is especially true in the complex world of cloud-native applications.

Missing application insights

Application observability remains an elusive beast for many, especially in complex microservices architectures. While infrastructure monitoring has become readily available, neglecting application data paints an incomplete picture, hindering effective troubleshooting and operations.

Siloed solutions

Traditional observability solutions have relied on siloed, proprietary agents and data sources, leading to fragmented visibility across teams and technologies. This makes it difficult to understand the complete picture of service composition and dependencies.

To me this is like trying to solve a puzzle with missing pieces – that’s essentially a problem that many DevOps teams face today – piecing together a picture of how microservices, serverless functions, databases, and other elements interact with one  another, and underlying infrastructure and cloud services they run on. This hinders collaboration and troubleshooting efforts, making it challenging to pinpoint the root cause of performance issues or outages.

Vendor lock-in

Many vendors’ products also lock customers’ data into their cloud services. This can result in customers paying through the nose, because licensing costs are predicated on the volume of data that is being collected and stored in the service providers’ backend SaaS services. It can also be very hard to exit these services once locked in.

These are all pitfalls we want to avoid at Causely as we build out our Causal AI services.

Want to see Causely in action? Request a demo. 

The Pillars of Our Observability Architecture Pointed Us to OpenTelemetry

OpenTelemetry provides us with a path to break free from these limitations, establishing a common framework that transcends programming languages and platforms that we are using to build our services, and satisfying the requirements laid out in the pillars of our observability architecture:

Precise instrumentation

OpenTelemetry offers automatic instrumentation options that minimize the amount of work we need to do on manual code modifications and streamline the integration of our internal observability capabilities into our chosen backend applications.

Unified picture

By providing a standardized data model powered by semantic conventions, OpenTelemetry enables us to paint an end to end picture of how all of our services are composed including application and infrastructure dependencies. We can also gain access to critical telemetry information, leveraging this semantically consistent data across multiple backend microservices even when written in different languages.

Vendor-neutral data management

OpenTelemetry enables us to avoid locking our application data into 3rd party vendors’ services by decoupling it from proprietary vendor formats. This gives us the freedom to choose the best tools on an ongoing basis based on the value they provide, and if something new comes along that we want to exploit, we can easily plug it into our architecture.

Resource-optimized observability

OpenTelemetry enables us to take a top down approach to data collection, starting with the problems we are looking to solve and eliminating unnecessary information. In doing so, this minimizes our storage costs and optimizes compute resources we need to support our observability pipeline.

We believe that following these pillars and building our Causal AI platform on top of OpenTelemetry will propel our product’s performance, enable rock-solid reliability, and ensure consistent service experiences for our customers as we scale our business. We will also minimize our ongoing operational costs, creating a win-win for us and our customers.

OpenTelemetry + Causal AI: Scaling for Performance and Cost Efficiency

Ultimately, observability aims to illuminate the behavior of distributed systems, enabling proactive maintenance and swift troubleshooting. Yet isolated failures manifest as cascading symptoms across interconnected services.

While OpenTelemetry enables back-end applications to use this data to provide a unified picture in maps, graphs and dashboards, the job of figuring out the cause and effect in the correlated data still requires highly skilled resources. This process can also be very time consuming, tying up personnel across multiple teams, with ownership for different elements of overall services.

There is a lot of noise in the industry right now about how AI and LLMs are going to magically come to the rescue, but reality paints a different picture. All of the solutions available in the market today focus on correlating data versus uncovering a direct understanding of causal relationships between problems and the symptoms they cause, leaving devops teams with noise, not answers.

Traditional AI and LLMs also require massive amounts of data as input for training and learning behaviors on a continuous basis. This is data that ultimately ends up being transferred and stored in some form of SaaS. Processing these large datasets is very computationally intensive. This all translates into significant cost overheads for the SaaS providers as customer datasets grow overtime – costs that ultimately result in ever increasing bills for customers.

By contrast, this is where Causal AI comes into its own, taking a fundamentally different approach. Causal AI provides operations and engineering teams with an understanding of the “why”, which is crucial for effective and timely troubleshooting and decision-making.

Application: Database Connection Noisy Neighbor causing service and infrastructure symptoms

Example causality chain: Database Connection Noisy Neighbor causing service and infrastructure symptoms

Causal AI uses predefined models of how problems behave and propagate. When combined with real-time information about a system’s specific structure, Causal AI computes a map linking all potential problems to their observable symptoms.

This map acts as a reference guide, eliminating the need to analyze massive datasets every time Causal AI encounters an issue. Think of it as checking a dictionary instead of reading an entire encyclopedia.

The bottom line is, in contrast to traditional AI, Causal AI operates on a much smaller dataset, requires far less resources for computation and provides more meaningful actionable insights, all of which translate into lower ongoing operational costs and profitable growth.

Summing it up

There’s massive potential for Causal AI and OpenTelemetry to come together to tackle the limitations of traditional AI to get to the “why.”  This is what we’re building at Causely. Doing so will result in numerous benefits:

  • Less time on Ops, more time on Dev: OpenTelemetry provides standardized data while Causal AI analyzes it to automate the root cause analysis (RCA) process, which will significantly reduce the time our devops teams have to spend on troubleshooting.
  • Instant gratification, no training lag: We can eliminate AI’s slow learning curve, because Causal AI leverages OpenTelemetry’s semantic language and Causal AI’s domain knowledge of cause and effect to deliver actionable results, right out of the box without massive amounts of data and with no training lag!
  • Small data, lean computation, big impact: Unlike traditional AI’s data gluttony and significant computational overheads, Causal AI thrives on targeted data streams. OpenTelemetry’s smart filtering keeps the information flow lean, allowing Causal AI to identify the root causes with a significantly smaller dataset and compute footprint.
  • Fast root cause identification: Traditional AI might tell us “ice cream sales and shark attacks rise together,” but Causal AI reveals the truth – it’s the summer heat and not the sharks, driving both! By understanding cause-and-effect relationships, Causal AI cuts through the noise and identifies the root causes behind performance degradation and service malfunctions.

Having these capabilities is critical if we want to move beyond the labor intensive processes associated with how RCA is performed in devops today. This is why we are eating our own dog food and using Causely as part of our tech stack to manage the services we provide to customers.

If you would like to learn how to unplug from the Matrix of guesswork and embrace the opportunity offered through the combination of OpenTelemetry and Causal AI, don’t hesitate to reach out! The team and I at Causely are here to share our experience and help you navigate the path.


Related Resources

Causely for asynchronous communication

Causely for async communication - broker OOM

Managing microservices-based applications at scale is challenging, especially when it comes to troubleshooting and pinpointing root causes.

In a microservices-based environment, when a failure occurs, it causes a flood of anomalies across the entire system. Pinpointing the root cause can be as difficult as searching for a needle in a haystack. In this video, we’ll share how Causely can eliminate human heavy lifting and automate the troubleshooting process.


Causely is the operating system to assure application service delivery by automatically preventing failures, pinpointing root causes, and remediating. Causely captures and analyzes cause and effect relationships so you can explore interesting insights and questions about your application environment.

Does this resonate with you? Feel free to share your troubleshooting stories here. We’d love to explore the ways Causely can help you!

Understanding failure scenarios when architecting cloud-native applications

Developing and architecting complex, large cloud-native applications is hard. In this short demo, we’ll show how Causely helps to understand failure scenarios before something actually fails in the environment.

In the demo environment we have a dozen applications with database servers, caches running in a cluster, providing multiple services. If we drill into these services and focus on the application, we can only see how the application is behaving right now. But Causely is automatically identifying the potential root causes and alerts that would be caused – services that would be impacted – by failures.

For example, a congested service would cause high latency across a number of different downstream dependencies. A malfunction of this service would make services unavailable and cause high error rates on the dependent services.

Causely is able to reason about the specific dependencies and all the possible root causes – not just for services, but for the applications – in terms of: what would happen if their database query takes too long, if their garbage collection time takes too long, if their transaction latency is high? What services would be impacted, and what alerts would it receive?

This allows developers to design a more resilient system, and operators can understand how to run the environment with their actual dependencies.

We’re hoping that Causely can help application owners avoid production failures and service impact by architecting applications to be resilient in the first place.

What do you think? Share your comments on this use case below.

Troubleshooting cloud-native applications with Causely

Running large, complex, distributed cloud-native applications is hard. This short demo shows how Causely can help.

In this environment, we are running a number of applications with database servers, caches, in a cluster, multiple services, pods, and containers. At any one point in time, we would be getting multiple alerts showing high latency, high CPU utilization, high garbage collection time, high memorization across multiple microservices. Troubleshooting what is the root cause of each one of these alerts is really difficult.

Causely automatically identifies the root cause and shows how the service that is actually congested causing all of these downstream alerts on its dependent services. Instead of individual teams troubleshooting their respective alerts, the team responsible for this product catalog service can focus on remediating and restoring this service while showing all of the other impacted services, so the teams are aware that their problems are caused by congestion in this service. This can significantly reduce the time to detect and to remediate and restore a service.

What do you think? Share your comments on this use case below.