Welcome back to our series, “One Million Ways to Slow Down Your Application.” Having previously delved into the nuances of Postgres configurations, we now journey into the world of Kafka and asynchronous communication, another critical component of scalable applications.
Kafka 101: An Introduction
Kafka is an open-source stream-processing software platform. Developed by LinkedIn and donated to the Apache Software Foundation, written in Scala and Java. It is designed to handle data streams and provide a unified, high-throughput, low-latency platform for handling real-time data feeds.
Top Use Cases for Kafka
Kafka’s versatility allows for different application use cases, including:
- Real-Time Analytics: Analyzing data in real-time can provide companies with a competitive edge. Kafka allows businesses to process massive streams of data on the fly.
- Event Sourcing: This is a method of capturing changes to an application state as a series of events which can be processed, stored, and replayed.
- Log Aggregation: Kafka can consolidate logs from multiple services and applications, ensuring centralized logging and ease of access.
- Stream Processing: With tools like Kafka Streams and KSQL, Kafka can be used for complex stream processing tasks.
Typical Failures of Kafka
Kafka is resilient, but like any system, it can fail. Some of the most common failures include:
- Broker Failures: Kafka brokers can fail due to hardware issues, lack of resources or misconfigurations.
- Zookeeper Outages: Kafka relies on Zookeeper for distributed coordination. If Zookeeper faces issues, Kafka can be adversely impacted.
- Network Issues: Kafka relies heavily on networking. Network partitions or latencies can cause data delays or loss.
- Disk Failures: Kafka persists data on disk. Any disk-related issues can impact its performance or cause data loss.
Typical Manifestations of Kafka Failures
Broker Metrics
Brokers are pivotal in the Kafka ecosystem, acting as the central hub for data transfer. Monitoring these metrics can help you catch early signs of failures:
- Under Replicated Partitions: A higher than usual count can indicate issues with data replication, possibly due to node failures.
- Offline Partitions Count: If this is non-zero, it signifies that some partitions are not being served by any broker, which is a severe issue.
- Active Controller Count: There should only ever be one active controller. A deviation from this norm suggests issues.
- Log Flush Latency: An increase in this metric can indicate disk issues or high I/O wait, affecting Kafka’s performance.
- Request Handler Average Idle Percent: A decrease can indicate that the broker is getting overwhelmed.
Consumer Metrics
Consumers pull data from brokers. Ensuring they function correctly is vital for any application depending on Kafka:
- Consumer Lag: Indicates how much data the consumer is behind in reading from Kafka. A consistently increasing lag may denote a slow or stuck consumer.
- Commit Rate: A drop in the commit rate can suggest that consumers aren’t processing messages as they should.
- Fetch Rate: A decline in this metric indicates the consumer isn’t fetching data from the broker at the expected rate, potentially pointing to networking or broker issues.
- Rebalance Rate: Frequent rebalances can negatively affect the throughput of the consumer. Monitoring this can help identify instability in the consumer group.
Producer Metrics
Producers push data into Kafka. Their health directly affects the timeliness and integrity of data in the Kafka ecosystem:
- Message Send Rate: A sudden drop can denote issues with the producer’s ability to send messages, possibly due to network issues.
- Record Error Rate: An uptick in errors can signify that messages are not being accepted by brokers, perhaps due to topic misconfigurations or broker overloads.
- Request Latency: A surge in latency can indicate network delays or issues with the broker handling requests.
- Byte Rate: A drop can suggest potential issues in the pipeline leading to the producer or within the producer itself.
The Criticality of Causality in Kafka
Understanding causality between failures and how they are manifested in Kafka is vital. Failures, be they from broker disruptions, Zookeeper outages, or network inconsistencies, send ripples across the Kafka ecosystem, impacting various components. For instance, a spike in consumer lag could be traced back to a broker handling under-replicated partitions, and an increase in producer latency might indicate network issues or an overloaded broker.
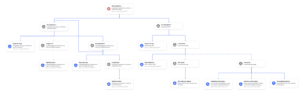
Furthermore, applications using asynchronous communications are much more difficult to troubleshoot than those using synchronous communications. As seen in the examples below, it’s pretty straightforward to troubleshoot using distributed tracing if the communication is synchronous. But with asynchronous communication, there are gaps in the spans that make it harder to understand what’s happening.

Figure 1: Example of distributed tracing with sync communication
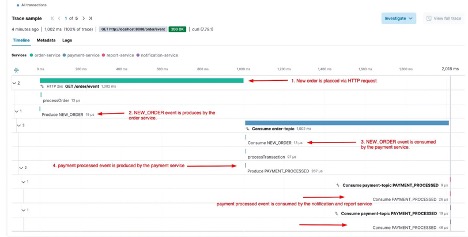
Figure 2: Example of distributed tracing for async communication
This isn’t about drawing a straight line from failure to manifestation; it’s about unraveling a complex network of events and repercussions. For every failure that occurs, the developer must first manually determine where the failure happened—was it the Broker? The Zookeeper? The Consumer? Following this, they need to zoom in and figure out the specific problem. Is it a broker misconfiguration or a lack of resources? A misconfigured Zookeeper? Or is the consumer application not consuming messages quickly enough, resulting in disk full?
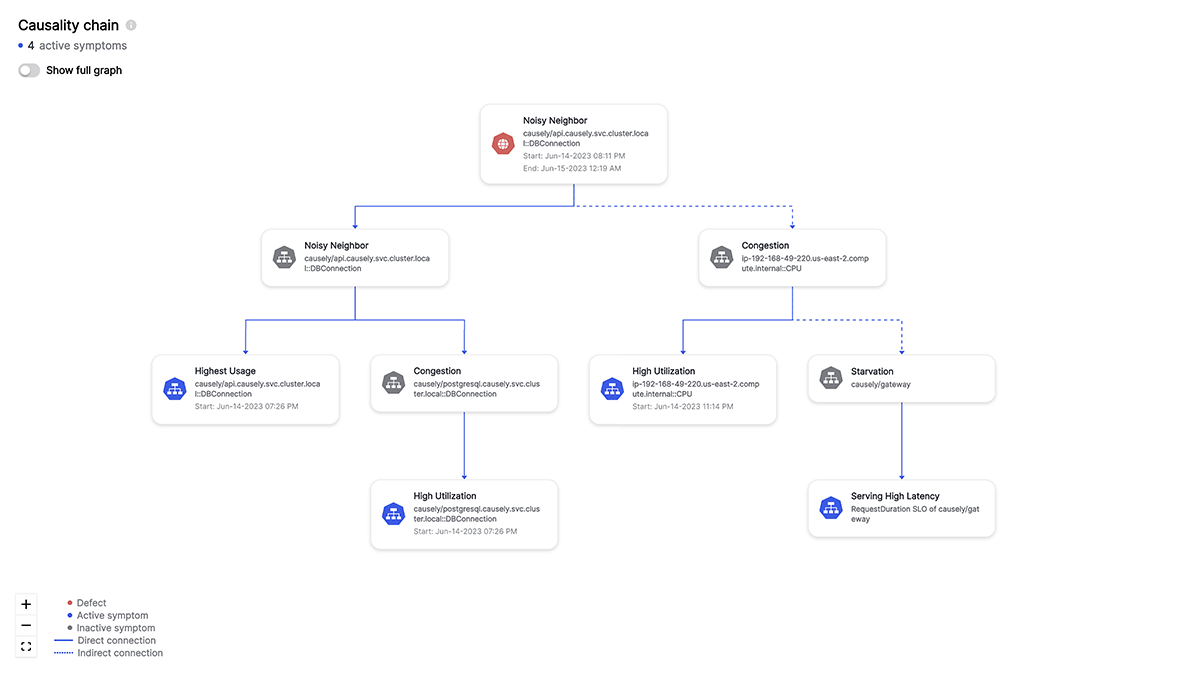
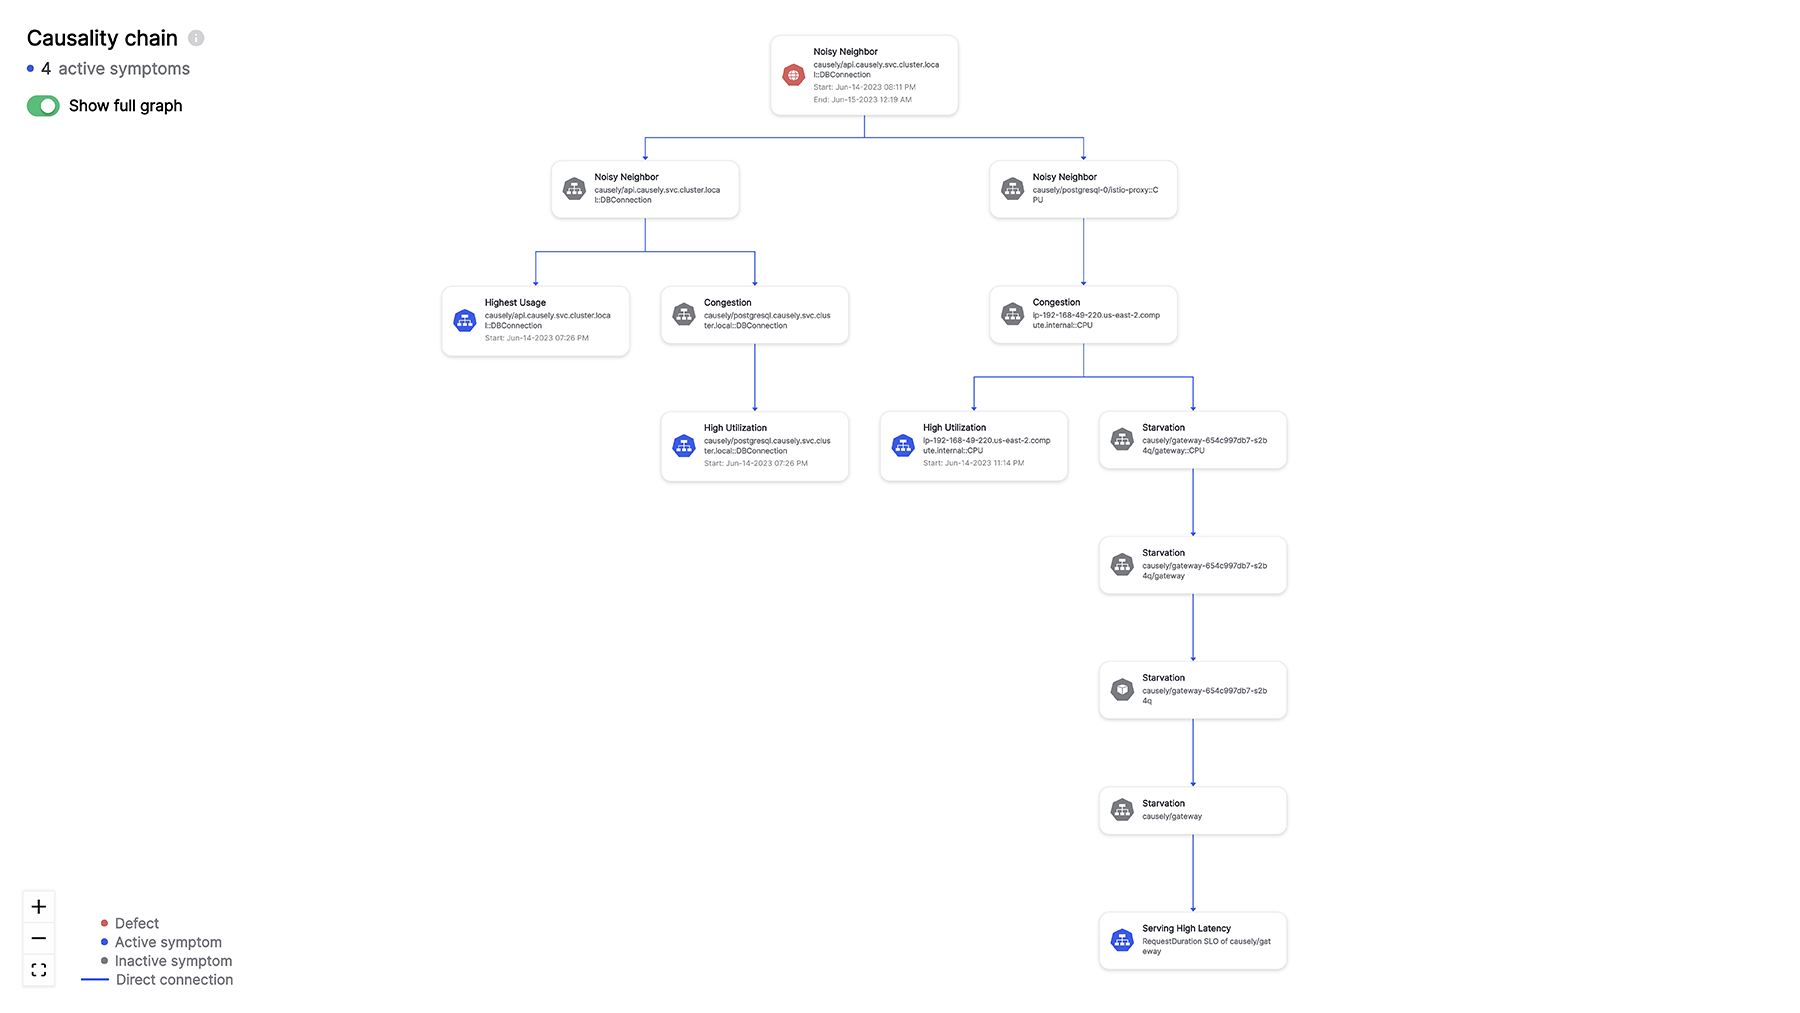
Software automation that captures causality can help get to the correct answer!
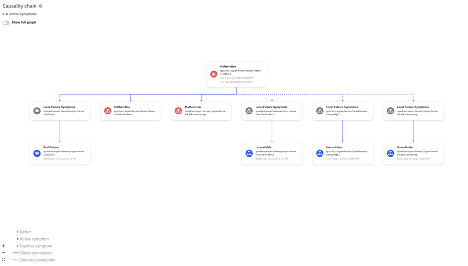
Figure 3: A Broker failure causes Producer failure
Signing Off
Delving into Kafka highlights the complexities of asynchronous communication in today’s apps. Just like our previous exploration of Postgres, getting the configuration right and understanding causality are key.
By understanding the role of each component and what could go wrong, developer teams can focus on developing applications instead of troubleshooting what happened in Kafka.
Keep an eye out for more insights as we navigate the diverse challenges of managing resilient applications. Remember, it’s not only about avoiding slowdowns, but also about building a system that excels in any situation.